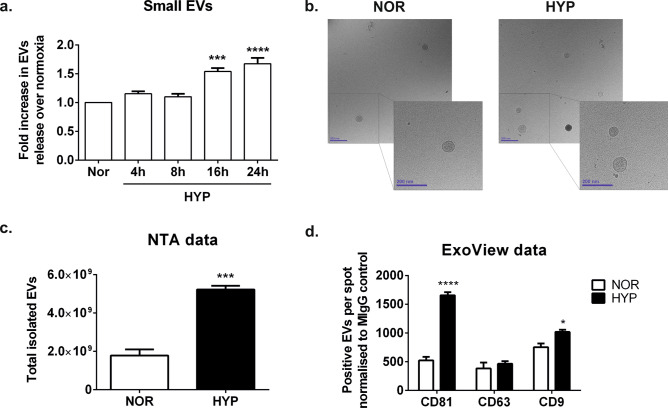
Figure 2.
Steady increase of small EV release under hypoxic conditions in HEK293T cells. (a) Time course experiment of EV release in HEK293T cells subject to hypoxia. The graph shows the NTA quantification of small EVs isolated by differential centrifugation protocol after a ultracentrifugation step at 100,000×g 75 min. Each data point was corrected by protein content in the cellular lysates and relativized to EVs determined in normoxic cells at the same time point. Data combined from N = 4 experiments, graphs shows mean ± SEM. Statistical analysis: One Way ANOVA with Dunnett’s multiple comparisons test. **p < 0.01, ***p < 0.001. (b) Cryoelectron micrographs of small EVs isolated from normoxic and hypoxic cells at 16 h time point. Magnification: 30,000 ×. Scale bar: 200 nm. (c) Nanoparticle tracking analysis quantification of small EVs from the conditioned media of normoxic or hypoxic cells. (d) ExoView characterization of EVs. Analysis of exosomal markers was carried out with the ExoView Tetraspanin Kit following the manufacturers protocol (c) and (d). Graphs show data analysed in triplicate (n = 3). Stats: (c) Two tailed t-test and (d) Two-way ANOVA, followed by Sidak’s multiple comparisons test, where * indicates p < 0.05, ***p < 0.001 and ****p < 0.0001.

