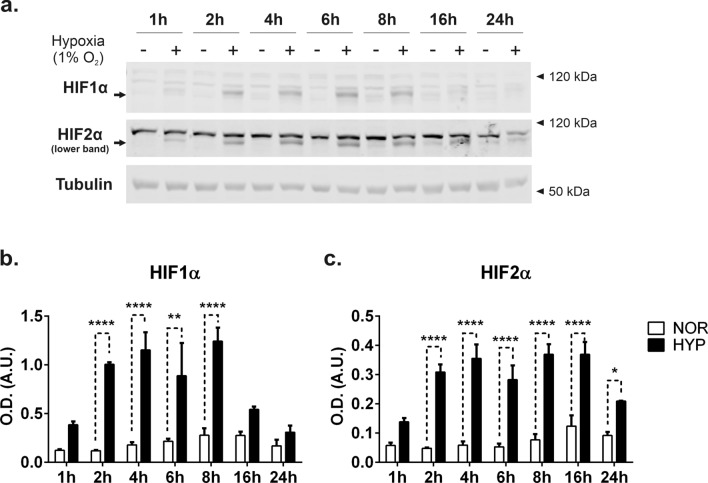
Figure 3.
HIF pathway dynamics in HEK293T exposed to hypoxia. (a) Cells were exposed to normoxic or hypoxic conditions for the times indicated. Lysates were obtained as indicated in the methods loaded onto SDS-PAGE and immunoblotted with antibodies for HIF1α or HIF2α. Note the upper bands are non-specific and commonly detected by this26 (and other27,28) commercial antibodies. Immunodetection of β-tubulin was used as loading control as indicated. Blots show a representative experiment of n = 3. (b, c) Quantification of western blot analysis. Graphs show the mean ± SEM. Statistical analysis: Two-way ANOVA, followed by Sidak’s multiple comparisons test. *indicates < 0.05, **p < 0.01, ***p < 0.001.

