Figure 6.
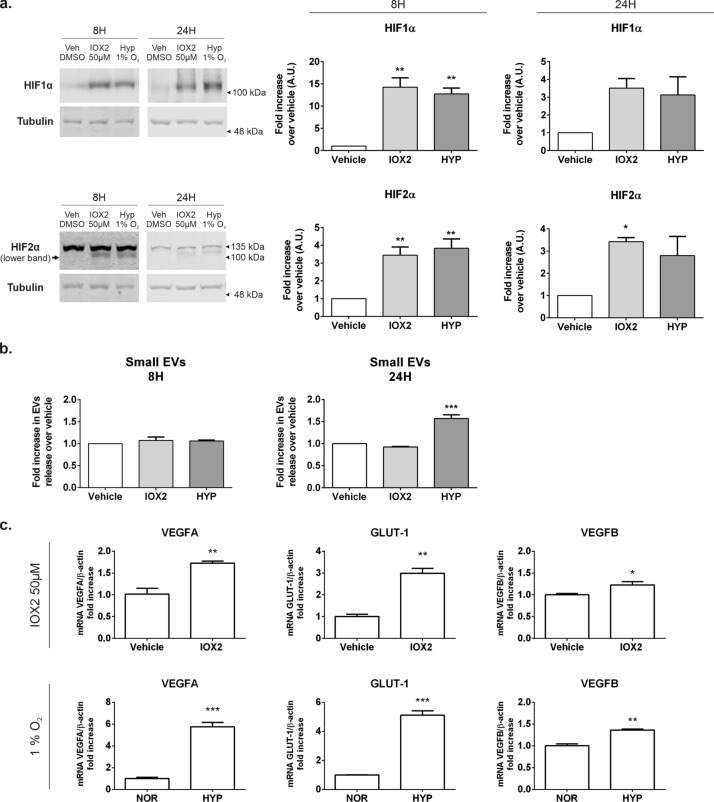
Prolyl hydroxylase inhibition does not increase small EV release in normoxic HEK293T cells. Expression of HIF1α and HIF2α in cells treated with vehicle (0.1% DMSO) or with 50 μM IOX2 for 8 h or 24 h. Cells were either left untreated or treated with IOX2 for the indicated times. (a) Cellular lysates were obtained, separated by SDS-PAGE and immunoblotted with specific antibodies for HIF1α, HIF2α or β-tubulin as loading control. Lower panels show the quantification of N = 3 independent experiments, each performed in triplicate. (b) Small EV release in cells treated with IOX2. Quantitation of small EVs by NTA measurement directly from the supernatant of the 10,000×g centrifugation of the conditioned media. Samples were conditioned media from cells either left untreated or treated with IOX2. Graphs show the amount of EVs corrected by total protein in cellular lysates and normalised over the vehicle mean of each independent experiment. Graphs show mean ± SEM of N = 3 independent experiments, each performed in triplicate. Statistic analysis: One-way ANOVA followed by Dunnet’s multiple comparisons test. *indicates < 0.05, **p < 0.01, ***p < 0.001. (c) Transcriptional activation of HIFs in IOX2 and hypoxia treated cells. Cells were either left untreated or treated with with 50 μM IOX2 in normoxic conditions, or placed under 1% hypoxia for 24 h. Total RNA was extracted and mRNA for HIF target genes was quantified by qPCR as detailed in the methods section. VEGFA and SLC2A1 are genes regulated by HIFs whereas VEGFB is not and was used as negative control. Statistical analysis: One-way ANOVA followed by Dunnet’s multiple comparisons test. *indicates < 0.05, **p < 0.01, ***p < 0.001.

