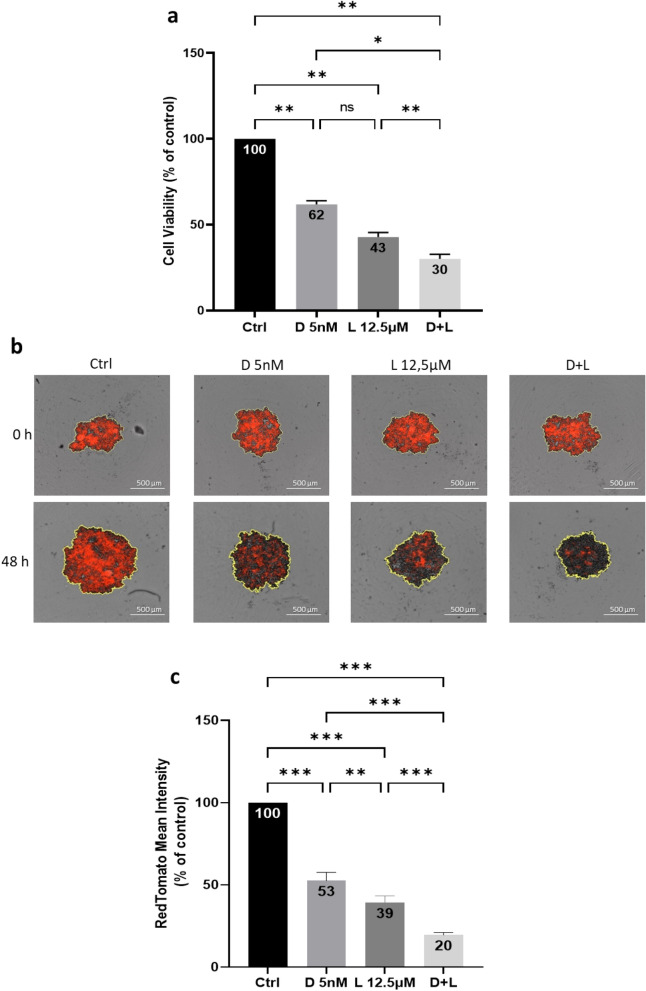
Figure 4.
Cytotoxicity of docetaxel and lovastatin for HGT-1 MCTS. (a) Cell viability was determined by the MTT assay after 48 h of treatment with 5 nM docetaxel (D 5 nM), 12.5 µM lovastatin (L 12.5 µM) and 5 nM docetaxel + 12.5 µM lovastatin (D + L) of six days-old HGT-1 spheroids. The results are shown as the mean ± SD of n = 3 independent experiments with four technical replicates in each. ns, p > 0.05; *p ≤ 0.05; **p ≤ 0.01, one-way ANOVA followed by Tukey analysis. (b) Red fluorescence photographs of 6 days-old spheroids formed by HGT-1cells expressing RedTomato at 0 h and 48 h of treatment with D 5 nM, L 12.5 µM and D + L captured with the Incucyte live imaging. (c) Fluorescence signal generation by 6 days-old HGT-1-RedTomato MCTS exposed to 5 nM docetaxel (D 5 nM), 12.5 µM lovastatin (L 12.5 µM) and 5 nM docetaxel + 12.5 µM lovastatin (D + L) for 48 h. The results are shown as the mean ± SD of n = 3 independent experiments with four technical replicates in each. **p ≤ 0.01; ***p ≤ 0.001, one-way ANOVA followed by Tukey analysis.

