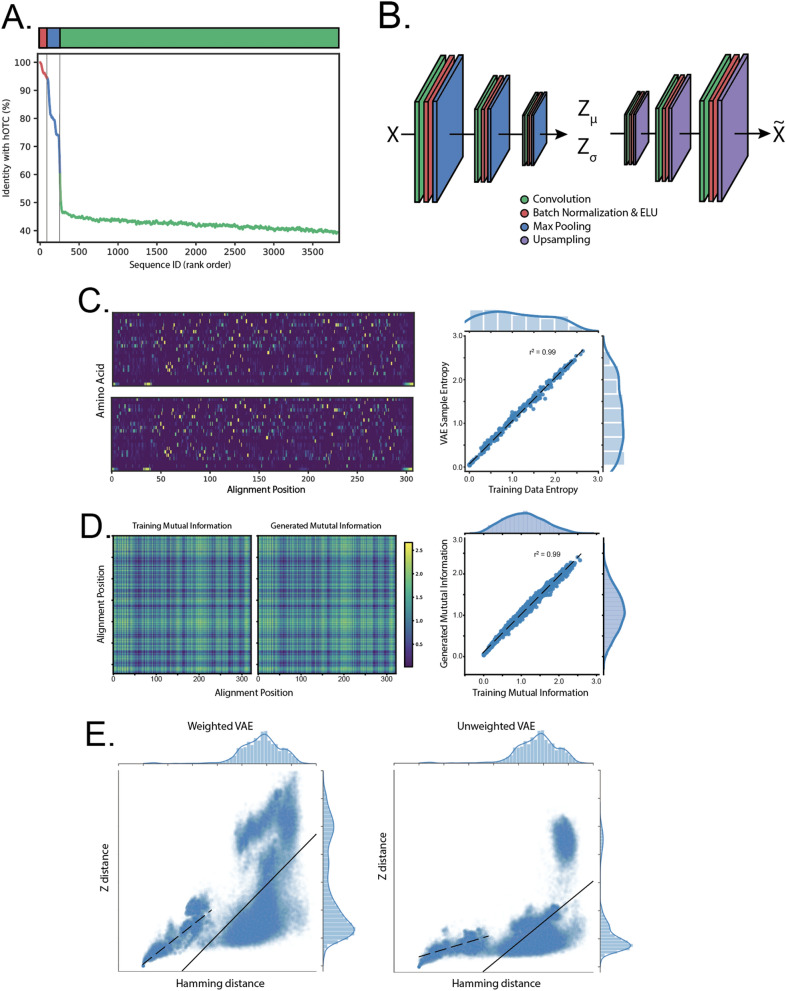
Figure 1.
A Variational Autoencoder (VAE) effectively models co-evolutionary dependencies in ornithine transcarbamylase (OTC). (A) Species distribution of the training dataset. Top, relative percentages of mammalian, eukaryotic and prokaryotic sequences, ordered by Hamming distance to human OTC (hOTC). Bottom, Hamming distances to hOTC for all sequences used in the training data. (B) VAE model schematic and parameters. The VAE consists of an encoding convolutional neural network (CNN) (left) which takes one-hot encoded sequences as input, and outputs the parameters of a multivariate Gaussian distribution ( and ). Samples from this distribution () are passed through a second decoding CNN. Both the encoder and decoder consist of multiple layers of convolution, batch normalization and pooling/up-sampling. The model is trained end-to-end to reproduce its input and regularized such that the distribution matches a Gaussian prior. (C) Per position amino acid frequency in VAE samples match those in the training data. Top left, average training data. Columns are distributions over amino acid frequency at each location in the alignment. Bottom left, as above, but for samples from the VAE model. Right, scatter plot of all amino acid frequencies (training vs. samples), (Pearson's value of 0.99). (D) Second-order correlations in VAE samples match those in the training data. Left, mutual information between all alignment locations in the training data. Middle, mutual information between all alignment location in VAE samples. Right, a scatter plot of position-to-position mutual information between the training data and the samples (Pearson's value of 0.99). (E) Positive correlation between Hamming and latent space distance. Left, scatter plot of Hamming distance and Euclidean distance in Z for a model with sequences weighted proportional to their Hamming distance to hOTC; right, same but with all sequences weighted equally. Overall correlations when considering all sequences are similar (Pearson's values of 0.25 vs 0.26, solid lines). In the weighted model, the 5% most similar training data exhibit higher correlation than the training data as a whole (Pearson's values of 0.81 vs 0.56, dashed lines).

