Figure 2.
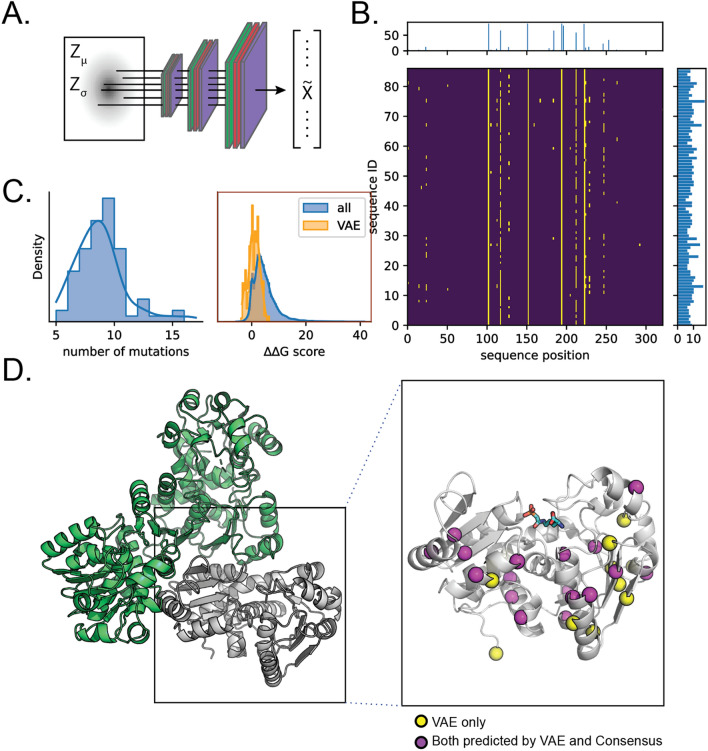
Sampling near-human OTCs. (A) Sampling schematic. By fixing to be OTC and progressively increasing , we obtained 87 mutants with minimal mutations with respect to hOTC. (B) Alignment of VAE OTCs highlighting mutation locations. Center, alignment of sequences ordered by mutation count. Yellow marks a difference with respect to hOTC. Right marginal, summed mutation counts for each sequence; top marginal, summed mutation counts, per position. (C) Summary metrics of mutations. Left, distribution of mutation count with respect to hOTC; right, distributions of predicted G values for all possible single substitutions and for the VAE substitutions only. (D) Mapping of mutation locations onto hOTC structure (PDB: 1OTH). A cartoon representation of a single hOTC monomer of the homotrimer is shown in the inset with the ornithine analog N-phosphonacetyl-L-ornithine shown in cyan sticks. Mutation locations predicted by the VAE model only are shown in yellow spheres, and those predicted by both VAE and consensus models are in purple spheres.

