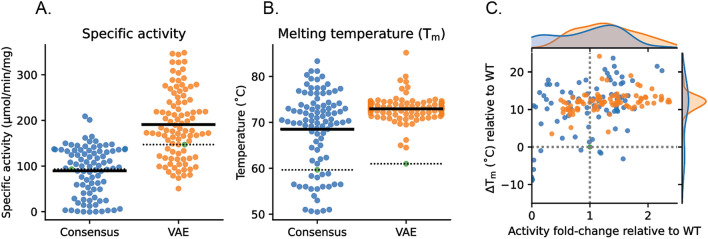
Figure 4.
Specific activity and thermostability of recombinant protein for VAE and consensus hOTC variants. (A) Specific activity (μmol citrulline/min/mg protein) distribution of recombinant protein for VAE (orange) and consensus (blue) hOTC variants. Specific activity of hOTC is indicated by a green dot and the dashed line, and the mean specific activity by the solid line. Each point represents the average of three separate trials for a unique variant. (B) Melting temperature (Tm in °C) distribution of recombinant protein for VAE (orange) and consensus (blue) hOTC variants. Tm of hOTC is indicated by a green dot and dashed line, and the mean by the solid line. Each point represents the average of three separate trials for a unique variant. (C) Scatter plot of thermal stability (∆Tm in °C) vs specific activity (fold-change) for all OTC variants relative to hOTC. Histograms of each population are plotted on the top and left axes. Orange dots represent VAE variants, and blue dots represent consensus variants. Variants show a mix of improved specific activity, thermal stability, or both. The hOTC values are indicated by the dashed line and green dot.

