Figure 5.
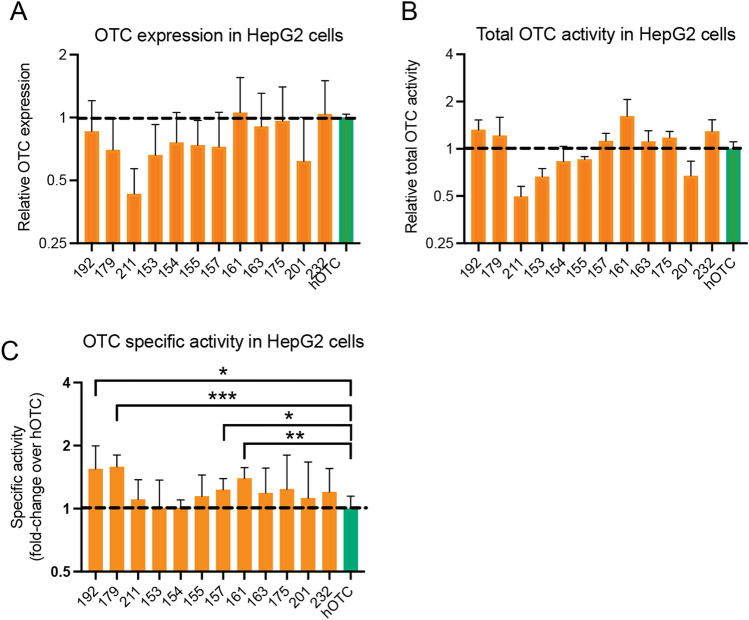
Performance of VAE hOTC variants in mammalian cells. (A) OTC expression in HepG2 cells transfected with OTC mRNAs. Expression was normalized relative to hOTC (black dashed line). Data points indicate the average values of three biological replicates and error bars indicate standard deviation. (B) Total OTC activity (nmol/min/mg total protein normalized to hOTC) in HepG2 cells transfected with OTC mRNAs. Data points indicate the average values of three biological and six technical replicates. Black error bars represent standard deviations. (C) OTC activity in HepG2 cells transfected with OTC mRNAs. Total activity (panel B, nmol citrulline/min/mg total protein) was normalized to the expression observed in panel A to determine specific activity of VAE OTCs. Asterisks represent significance of < 0.004 under Bonferroni-corrected t test.

