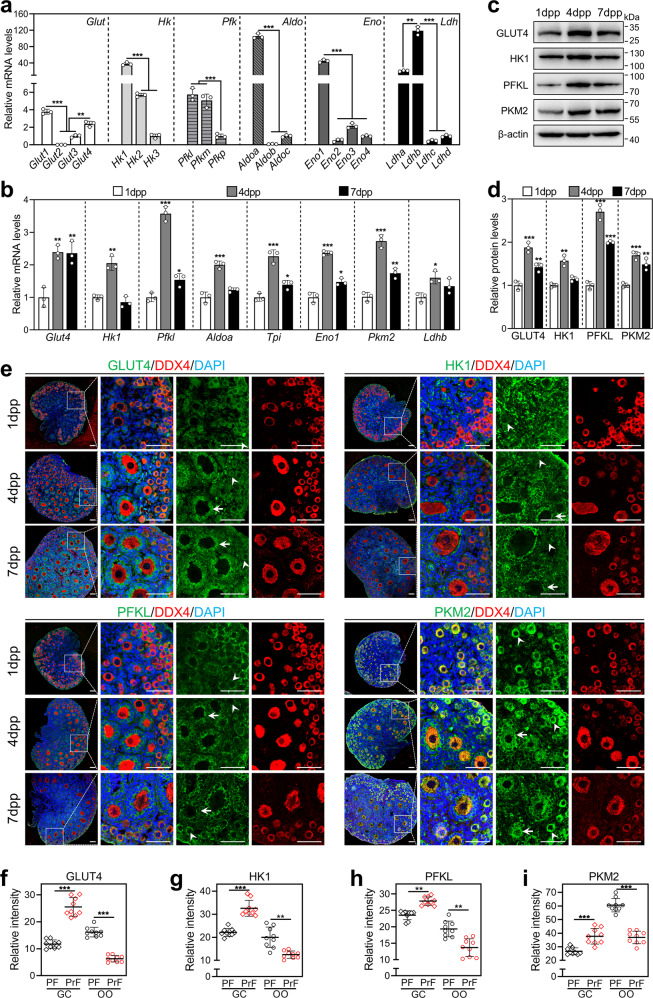
Fig. 1. The expression pattern of glycolysis-related genes and proteins in neonatal mouse ovaries.
a The mRNA levels of the isoforms in each family of Glut, Hk, Pfk, Aldo, Eno, and Ldh in mouse ovaries at 4 dpp. The mRNA values of Glut3, Hk3, Pfkp, Aldoc, Eno4, and Ldhd were set as 1. (n = 3 independent experiments). Bars indicate the mean ± SD. **P < 0.01 and ***P < 0.001. b The mRNA levels of Glut4, Hk1, Pfkl, Aldoa, Eno1, Tpi, Pkm2, and Ldhb in the ovaries at 1, 4 and 7 dpp. (n = 3 independent experiments). Bars indicate the mean ± SD. *P < 0.05, **P < 0.01, and ***P < 0.001 vs. 1 dpp group. c, d The protein levels of GLUT4, HK1, PFKL, and PKM2 in the ovaries at 1, 4, and 7 dpp. (n = 3 independent experiments). β-actin was used as an internal control. Bars indicate the mean ± SD. **P < 0.01 and ***P < 0.001 vs. 1 dpp group. e Immunofluorescence stain of GLUT4, HK1, PFKL, and PKM2 (green) in the ovaries at 1, 4, and 7 dpp. (n = 3 independent experiments). The cytoplasm of oocytes was stained with the oocyte-specific marker DDX4 (red), and the nuclei were counterstained by DAPI (blue). The arrowheads and the arrows show the primordial and primary follicles, respectively. Scale bars: 50 μm. f–i The intensity of GLUT4 (f), HK1 (g), PFKL (h), and PKM2 (i) fluorescent signals in granulosa cells (GC) and oocytes (OO) of primordial follicles (PF) and primary follicles (PrF). (n = 9 sections from 7 dpp ovaries. The total number of 45 follicles was scored in each group). Bars indicate the mean ± SD. **P < 0.01 and ***P < 0.001. The representative images are shown.

