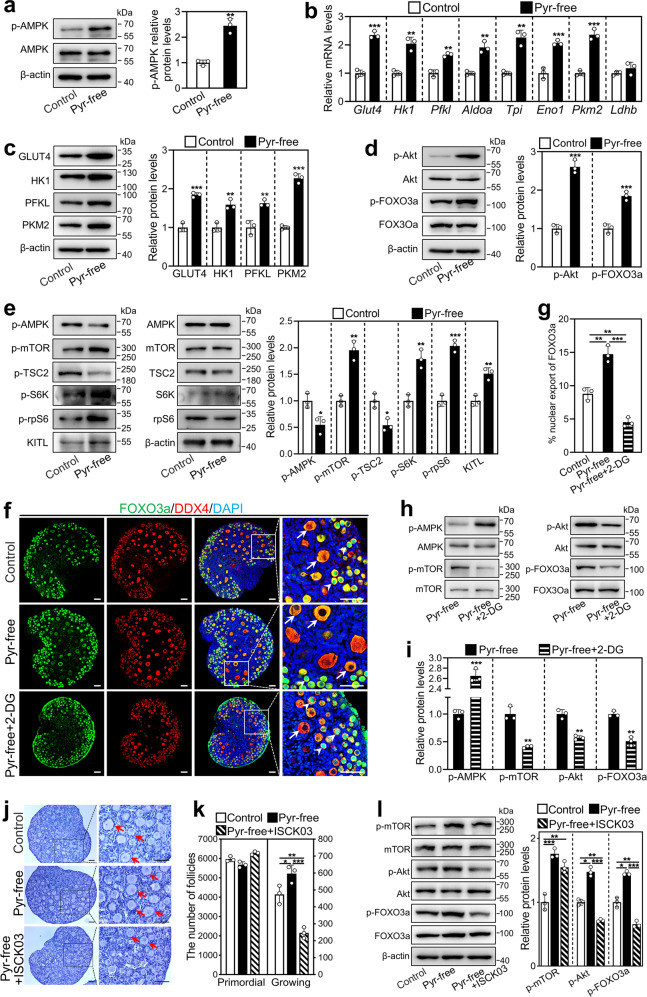
Fig. 3. Effect of short-term pyruvate deprivation on glycolysis and mTOR signaling in cultured mouse ovaries.
Ovaries at 2 dpp were cultured in standard (control) or pyruvate-free (pyr-free) medium for 6 h (a), 12 h (b), 24 h (c, e) and 48 h (d, f, g), or cultured in pyruvate-free medium supplemented with 10 mM 2-DG (pyr-free + 2-DG) or 5 μM ISCK03 (pyr-free + ISCK03) for 48 h (f–l). a The protein levels of p-AMPK in the control and pyruvate-free group. b The mRNA levels of Glut4, Hk1, Pfkl, Aldoa, Eno1, Tpi, Pkm2, and Ldhb in the control and pyruvate-free group. c The protein levels of GLUT4, HK1, PFKL, and PKM2 in the control and pyruvate-free group. d The protein levels of p-Akt and p-FOXO3a in the control and pyruvate-free group. e The protein levels of p-AMPK, p-mTOR, p-TSC2, p-S6K, p-rpS6, and KITL in the control and pyruvate-free group. f, g The localization of FOXO3a in oocyte nuclear (arrowheads) and cytoplasm (arrows, f) and the percentage of oocytes with FOXO3a nuclear export (g) in each section in the control, pyruvate-free and pyruvate-free + 2-DG groups. FOXO3a, green; DDX4, red; DAPI, blue. Scale bars: 50 μm. h, i The protein levels of p-AMPK, p-mTOR, p-Akt, and p-FOXO3a in the pyruvate-free (as control) and pyruvate-free + 2-DG group. 2-DG, 2-deoxyglucose. j, k Morphological comparison of the ovaries (j) and the number of primordial and growing follicles (arrows. k) in the control, pyruvate-free and pyruvate-free + ISCK03 groups. Nuclei were stained by hematoxylin. Scale bars: 50 μm. l The protein levels of p-mTOR, p-Akt and p-FOXO3a in the control, pyruvate-free and pyruvate-free + ISCK03 groups. All the experiments were repeated three times, and the representative images are shown. In western blot results, total AMPK, mTOR, TSC2, S6K, rpS6, Akt, and FOXO3a were used as the corresponding internal control for p-AMPK, p-mTOR, p-TSC2, p-S6K, and p-rpS6, p-Akt, and p-FOXO3a, respectively, and β-actin was used as the internal control for GLUT4, HK1, PFKL, PKM2, and KITL. Bars indicate the mean ± SD. *P < 0.05, **P < 0.01, and ***P < 0.001.

