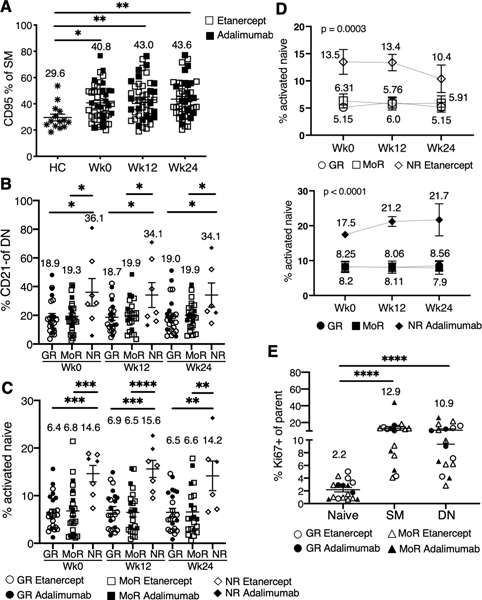
Figure 4. RA responders have lower frequencies of activated memory B cells and more proliferating B cells.
(A) Frequencies of CD95+ SM at baseline (Wk0, n=49), 12 week (Wk12, n=48) and 24 week (Wk24, n=46) compared to healthy controls (HC, n=14). *p<0.05, **p<0.01. (B) Means (±SEM) for % CD21- DN at different time points for good (GR), moderate (MoR) and non-responders (NR). *p<0.05. (C) Scatter plots showing frequencies of activated naïve B cells in GR: (n=24 Wk0, n=23 Wk12, n=23 Wk24), MoR (n=24 Wk0, n=23 Wk12, n=21 Wk24) and NR (n=7 Wk0, n=7 Wk12, n=6 Wk24). Error bars represent Mean+ SEM. **p<0.01,*** p<0.001, **** p<0.0001 by Tukey’s multiple comparison test. (D) Line plots represent frequencies of activated naïve B cells in etanercept (top) or adalimumab (bottom) group. Each line represents GR, MoR or NR over time (etanercept: n=14 GR, n=18 MoR, n=5 NR; adalimumab: n=10 GR, n=7 MoR, n=2 NR). The values on the graph represent the mean. (E) The plot is a scatter plot of frequencies of Ki67+ in naïve, SM and DN B cell from GR (n=7) or MoR (n=10) (no NR B cells available for analysis) at Wk0. Mean± SEM, ****p<0.0001 as indicated comparisons.

