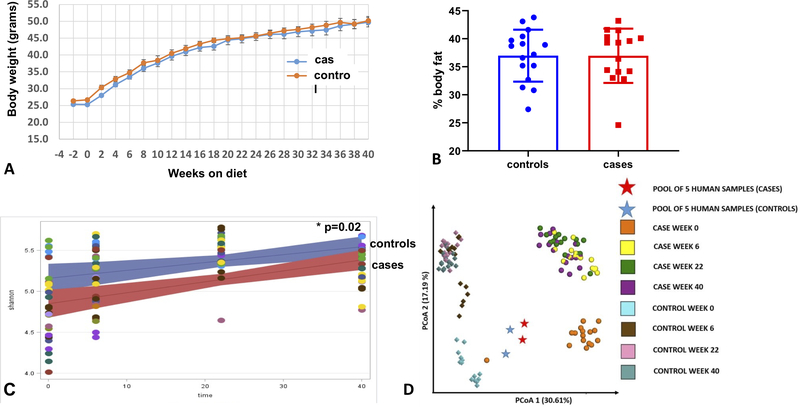
Figure 3.
Effects of a high fat and high sucrose diet after transfer of human OA case and control fecal samples to germ free mice. A, Body weight of mice starting at time of fecal transplant (−2 weeks) and then bi-weekly while on the high fat and high sucrose diet for 40 weeks. B, %body fat mesured by MRI after 40 weeks on diet. C, Linear mixed-effects model regression of Shannon index from fecal samples collected at the start of the diet (time 0 which is 2 weeks after fecal transplant) and after 6, 22, and 40 weeks on diet. Lines represent linear mixed-effects regression (and 95% confidence interval) of Shannon diversity over time. Each dot represents a mouse and those with the same color indicates they were caged together. D, PCoA Emperor Plot based on Bray-Curtis beta-diversity metric. Points represent samples from the two groups: OA cases (circle) and OA controls (diamond). Time points are colored coded as indicated on the graph. Stars indicate duplicate samples of the pooled human feces analyzed prior to transplant to mice. Numbers in parentheses indicate the percent variation explained by the corresponding axis. The distance between 2 points shows how compositionally different the samples are.

