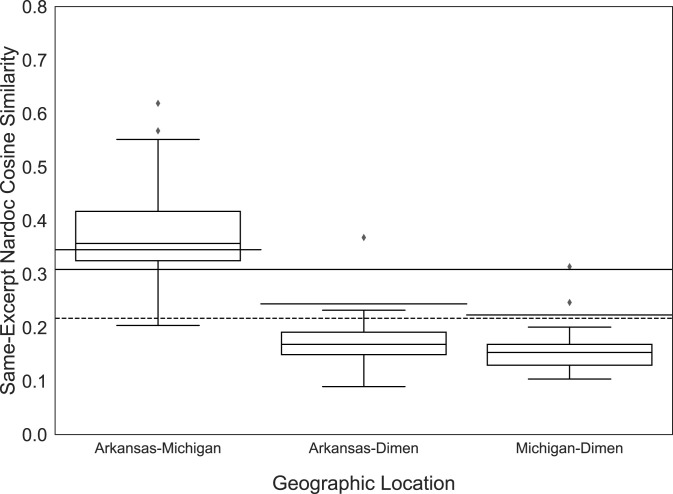
Fig. 4.
Comparison of stories prompted by the same music excerpt at different geographic locations. For each of the 32 excerpts, we calculated the cosine similarities between the corresponding TF-IDF vectors for narrative documents collected at each geographic location. The three box-and-whisker plots depict the median value and quantiles of the distribution of same-excerpt similarity values in each comparison between geographic locations. Individual data points (diamonds) correspond to document similarity values that exceed 1.5× the IQR. The values of the solid lines represent particularly conservative estimates of document similarities corrected for multiple comparisons (short lines = same-sample thresholds; long line = control-sample threshold). The long dotted line corresponds to the median value of the Princeton-Michigan permuted distribution and represents an estimate of the average similarity expected between unprompted stories by US college undergraduates. The long dotted line serves as an additional reference point and not as a threshold for significance.

