Fig. 2.
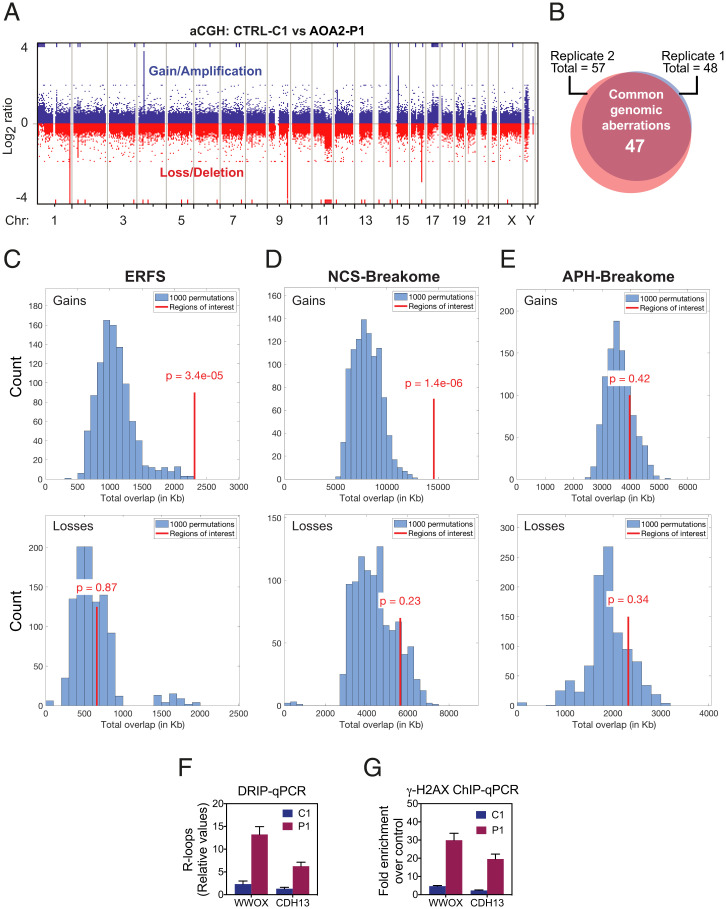
Genome-wide chromosome instability in AOA2 fibroblasts. (A) aCGH analyses carried out with genomic DNA from CTRL-C1 and AOA2-P1 fibroblasts. Representative whole-genome plot of aCGH profile is shown. Blue and red lines indicate chromosome regions with gains/amplifications and losses/deletions, respectively. (B) Venn diagram showing the overlap of chromosome aberrations detected in two independent aCGH experiments, as in A. (C, Upper) Histogram showing overlaps between 1,000 permuted AOA2-P1 fibroblast gain regions with ERFS. (Lower) Overlaps between 1,000 permuted AOA2-P1 fibroblast loss regions with the ERFSs. Red line indicates the degree of overlap (in kilobases). P values for the overlap compared to permutations are shown, with P < 0.05 considered a significant enrichment/depletion. (D and E) As C, showing overlaps between AOA2-P1 fibroblast gain and loss regions with NCS-breakome and APH-breakome sensitive regions. (F) DRIP-qPCR analyses, using the R-loop–specific S9.6 monoclonal antibody, were carried out with genomic DNA from CTRL-C1 and AOA2-P1 fibroblasts. R-loop prone regions at WWOX and CDH13 genes were analyzed. Relative values of R-loops immunoprecipitated in each region, normalized to input values and to the signal at the SNRPN-negative control region, are shown. Data represent the mean ± SEM of three independent experiments. (G) ChIP-qPCR analyses at WWOX and CDH13 genes using a γ-H2AX antibody was carried out with cross-linked chromatin from CTRL-C1 and AOA2-P1 fibroblasts. Fold-enrichment was calculated as a ratio of γ-H2AX antibody signal versus control IgG. Data represent the mean ± SEM of three independent experiments.

