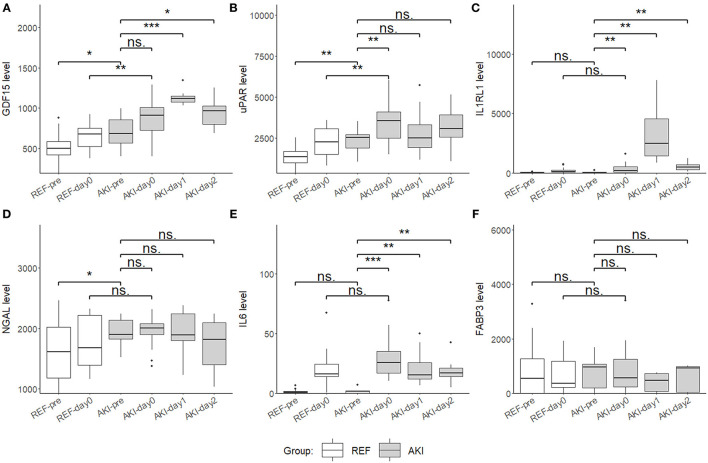
Figure 5.
Boxplots showing the plasma level of six candidate biomarkers in the discovery cohort using Quantibody Custom Array. (A) Growth differentiation factor 15 (GDF15), (B) uPAR, (C) IL1RL1, (D) NGAL, (E) IL6, and (F) FABP3 plasma levels of AKI group (n = 17) and control group (n = 21) at 4 time point, pre (pre-operation), day0 (ICU arrival after surgery), day1 and day2, were measured and compared. Boxplot represents the median and interquartile range (IQR), whiskers adjacent values (extreme values within 1.5 IQR of nearest quartile), and points outside values. ***p < 0.001, **p < 0.01, *p < 0.05, ns. p > 0.05.

