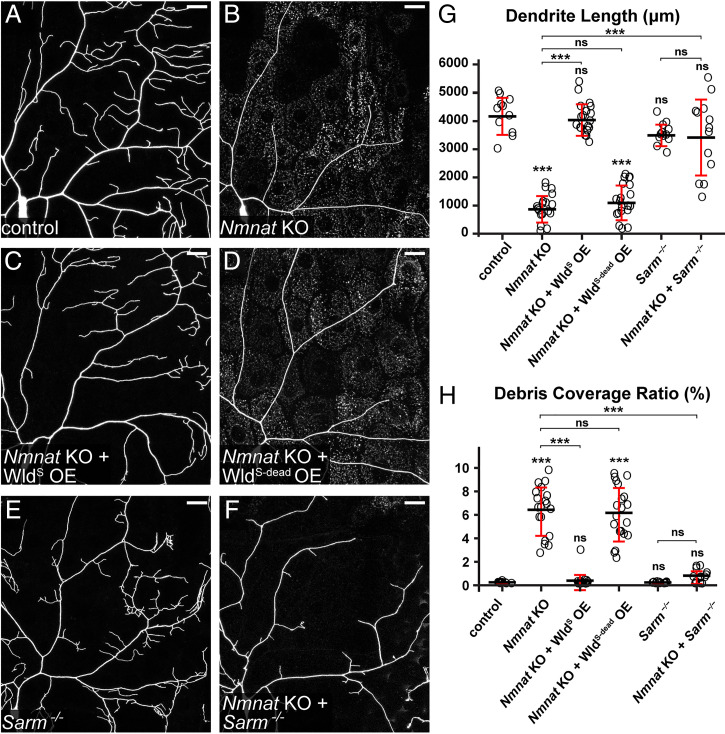
Fig. 1.
Nmnat KO induces Sarm-dependent, spontaneous dendrite degeneration. (A–F) Partial dendritic fields of control (A), Nmnat KO (B), Nmnat KO + WldS OE (C), Nmnat KO + WldS-dead OE (D), Sarm4705/4621 (E), and Nmnat KO + Sarm4705/4621 (F) ddaC C4da neurons. Neurons were labeled by ppk > CD4-tdTom (A–D) and ppk-CD4-tdTom (E and F). The C4da-specific KO was induced by ppk-Cas9. (Scale bars, 25 μm.) (G) Quantification of dendrite length. n = number of neurons: control (n = 11, six animals); Nmnat KO (n = 19, 10 animals); Nmnat KO + WldS OE (n = 17, 10 animals); Nmnat KO + WldS-dead OE (n = 20, 11 animals); Sarm4705/4621 (n = 12, six animals); and Nmnat KO + Sarm4705/4621 (n = 13, eight animals) (one-way ANOVA and Tukey’s test). (H) Quantification of debris coverage ratio, which is the percentage of debris area normalized by dendrite area ratio. Number of neurons is the same as in G. Kruskal–Wallis (one-way ANOVA on ranks) and Dunn’s test; P values were adjusted with the Benjamini–Hochberg method. For all quantifications, ***P ≤ 0.001 and ns, not significant. The significance level above each genotype is for comparison with the control. Black bar, mean; red bar, SD.

