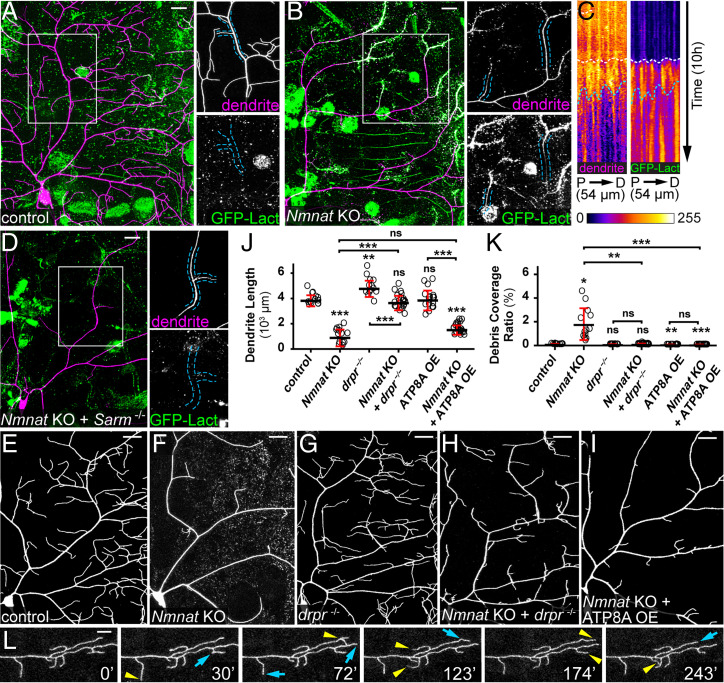
Fig. 2.
PS exposure–mediated phagocytosis causes dendrite degeneration of Nmnat KO neurons. (A) A control ddaC neuron showing the lack of GFP-Lact labeling. Insets show close-ups of an intact dendrite. (Scale bar, 25 μm.) (B) A Nmnat KO ddaC neuron undergoing spontaneous degeneration and showing labeling by GFP-Lact. In the Inset, the outlined dendrite segments do not show obvious blebbing or fragmentation but are weakly labeled by GFP-Lact. (Scale bar, 25 μm.) (C) Kymographs of dendrite signal (CD4-tdTom, Left) and GFP-Lact binding (Right) along a dendrite segment of a Nmnat KO ddaC neuron over time. For each kymograph panel, the x-axis corresponds to the straightened dendrite segment from the proximal (P) to the distal (D) end; the y-axis corresponds to time, with each row of pixels representing the maximum intensity along the dendrite in one frame. The total length of the dendrite and the total time are indicated. White dotted lines indicate the timing of GFP-Lact initial binding to the dendrite; blue dotted lines indicate the timing of the dendrite fragmentation based on the continuity of the dendrite signal (Movie S1). (D) Dendrites of a Nmnat KO + Sarm4705/4621 ddaC neuron showing the lack of GFP-Lact labeling. Insets show close-ups of an intact dendrite. (Scale bar, 25 μm.) (E–I) Partial dendritic fields of control (E), Nmnat KO (F), drpr−/− (G), Nmnat KO + drpr−/− (H), and Nmnat KO + ATP8A OE (I) neurons. (Scale bars, 25 μm.) (J) Quantification of dendrite length. n = number of neurons: control (n = 13, seven animals); Nmnat KO (n = 13, seven animals); drpr−/− (n = 14, eight animals); Nmnat KO + drpr−/− (n = 22, 14 animals); ATP8A OE (n = 17, nine animals); and Nmnat KO + ATP8A OE (n = 23, nine animals) (one-way ANOVA and Tukey’s test). (K) Quantification of debris coverage ratio. Number of neurons is the same as in J. Kruskal–Wallis (one-way ANOVA on ranks) and Dunn’s test; P values adjusted with the Benjamini–Hochberg method. (L) A time series of Nmnat KO + drpr−/− dendrites. Yellow arrowheads indicate growth of dendrites compared to the previous frame; blue arrows indicate retractions of dendrites compared to the previous frame (Movie S2). (Scale bar, 10 μm.) In all panels, neurons were labeled by ppk-CD4-tdTom (A–H) and ppk-MApHS (I). C4da-specific KO was induced by ppk-Cas9. For all quantifications, *P ≤ 0.05, **P ≤ 0.01, ***P ≤ 0.001, and ns, not significant. The significance level above each genotype is for comparison with the control. Black bar, mean; red bar, SD.

