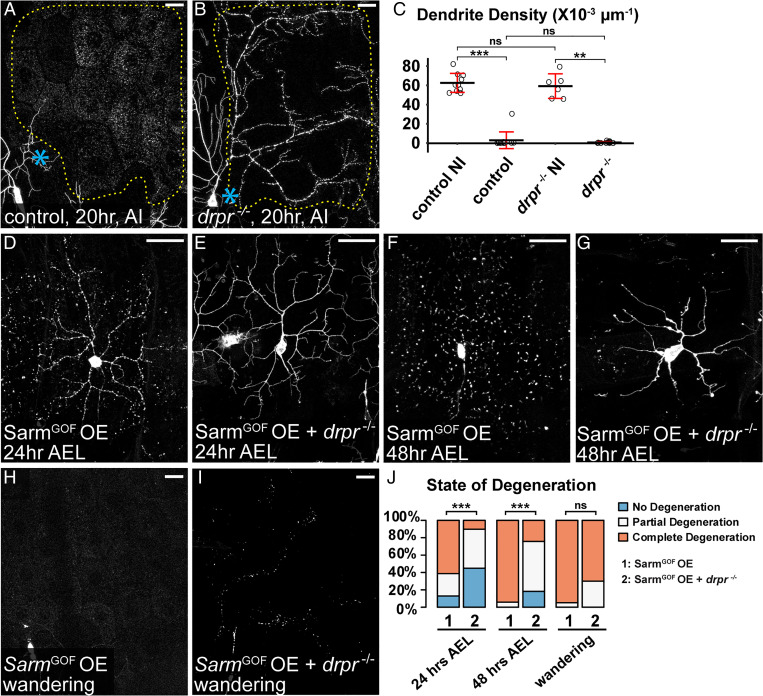
Fig. 5.
Injury and Sarm GOF cause phagocytosis-independent dendrite self-destruction. (A and B) Partial dendritic fields of ddaC neurons in control (A) and drpr−/− (B) animals 20 h AI. The dendrite debris lining up in the original dendritic pattern in B indicates dendrite fragmentation and the lack of epidermal engulfment. Blue asterisk, injury site. Yellow dots outline regions covered by injured dendrites. (C) Quantification of dendrite density. n = number of neurons: control no injury (NI) (n = 10, 10 animals); control AI (n = 12, six animals); drpr−/− NI (n = 6, five animals); drpr−/− AI (n = 13, five animals) (Kruskal–Wallis, one-way ANOVA on ranks, and Dunn’s test). P values were adjusted with the Benjamini–Hochberg method. (D–G) ddaC neurons in SarmGOF OE 24 h AEL (D), SarmGOF OE + drpr−/− 24 h AEL (E), SarmGOF OE 48 h AEL (F), and SarmGOF OE + drpr−/− 48 h AEL (G). (H–I) Partial dendritic fields of SarmGOF OE (H) and SarmGOF OE + drpr−/− (I) ddaC neurons at the wandering stage. (J) Quantification of dendrite degeneration showing percentages of neurons undergoing partial degeneration, complete degeneration, and no degeneration. n = number of neurons: SarmGOF OE 24 h AEL (n = 31, seven animals); SarmGOF OE + drpr−/− 24 h AEL (n = 49, 17 animals); SarmGOF OE 48 h AEL (n = 17, seven animals); SarmGOF OE + drpr−/− 48 h AEL (n = 33, 11 animals); SarmGOF OE wandering (n = 19, 14 animals); and SarmGOF OE + drpr−/− wandering (n = 10, six animals) (Freeman–Halton extension of Fisher’s exact test). In image panels above, neurons were labeled by ppk-MApHS (A and B) and ppk > CD4-tdTom (D–I). C4da-specific KO was induced by ppk-Cas9. For all quantifications, **P ≤ 0.01, ***P ≤ 0.001, and ns, not significant. Black bar, mean; red bar, SD. (Scale bars, 25 μm.)

