Fig. 7.
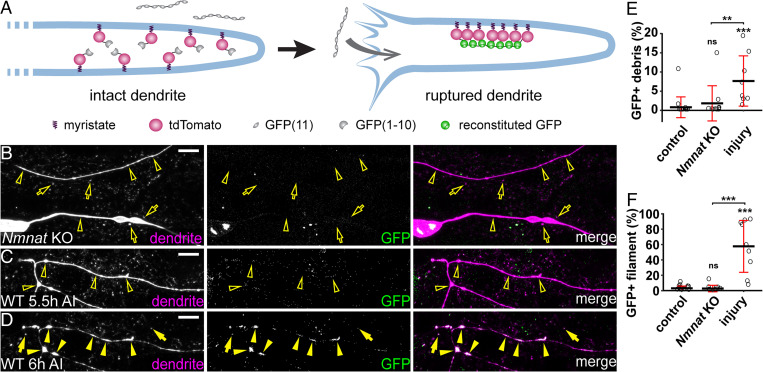
Injured dendrites undergo severe membrane rupture during dendrite fragmentation. (A) A diagram for the membrane-rupture assay. Extracellular GFP(11)x7 is separated from intracellular myr-tdTom-GFP(1-10) attached to the inner membrane of dendrites. Fluorescent GFP is reconstituted only when the dendrite membrane is ruptured to allow diffusion of GFP(11)x7 into the cytoplasm of neurons. (B) Nmnat KO dendrites (open arrowheads) and debris (open arrows) lacking reconstituted GFP in the membrane-rupture assay. (Scale bar, 10 μm.) (C) Injured wild-type dendrites before fragmentation (open arrowheads) lacking reconstituted GFP at 5.5 h AI. (Scale bar, 10 μm.) (D) Reconstituted GFP-labeling in fragmented dendrites (arrowheads) and debris (arrows) at 6 h AI. C and D show the same dendrites at two different time points. (Scale bar, 10 μm.) (E) Quantification of GFP-positive debris, showing the percentage of GFP-positive debris area in tdTom-positive debris area. Number of regions of interests (ROIs): wild-type NI control (n = 15, seven animals); Nmnat KO NI (n = 10, six animals); and wild-type 6 h AI (n = 10, four animals). (Kruskal–Wallis, one-way ANOVA on ranks, and Dunn’s test). P values were adjusted with the Benjamini–Hochberg method. (F) Quantification of GFP-positive filament, showing the percentage of GFP-positive filament area in tdTom-positive filament area. Number of ROIs: same as in D (Kruskal–Wallis, one-way ANOVA on ranks, and Dunn’s test). P values were adjusted with the Benjamini–Hochberg method. For all quantifications, **P ≤ 0.01; ***P ≤ 0.001, and ns, not significant. The significance level above each genotype is for comparison with the control. Black bar, mean; red bar, SD.

