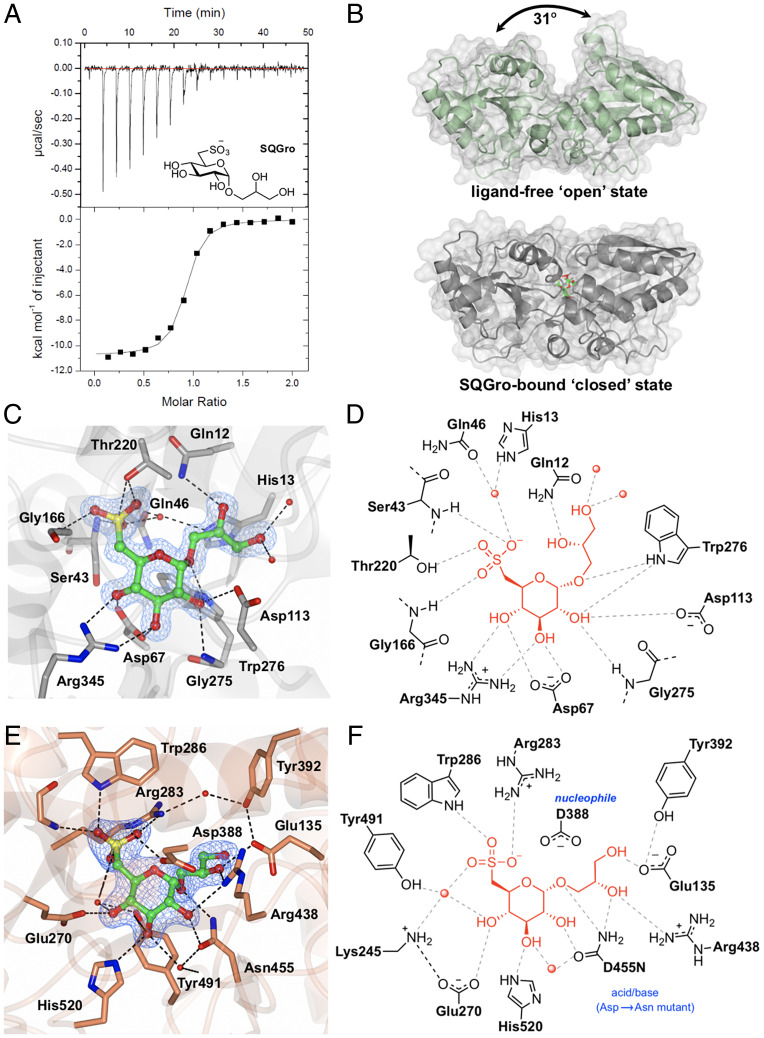
Fig. 2.
Biochemical and structural analyses of the SQGro-binding protein SmoF (Atu3282) and SQase SmoI (Atu3285). (A) Isothermal titration calorimogram for SmoF titrated against its cognate ligand 2’R-SQGro. The data are representative of two independent experiments (SI Appendix, Fig. S5). (B) Ribbon diagrams (with transparent surface) for the open and closed (liganded) conformations of SmoF. The 2’R-SQGro is bound tightly in the interdomain cleft and is inaccessible to the bulk solvent in the closed conformation. (C) Interactions between protein and ligand within the SmoF•2’R-SQGro complex: SmoF is in gray, 2’R-SQGro is in green, and the 2Fo − Fc map at 1.5σ is in blue. (D) An illustration highlighting key interactions from C. (E) Interactions between protein and ligand within the complex pf SmoI-D455N SQase and 2’R-SQGro: SmoI is in gold, 2’R-SQGro is in green, and the 2Fo − Fc map at 1.5σ is in blue. (F) An illustration highlighting key interactions from E: red spheres represent ordered water molecules; dotted lines represent proposed hydrogen bonds.

