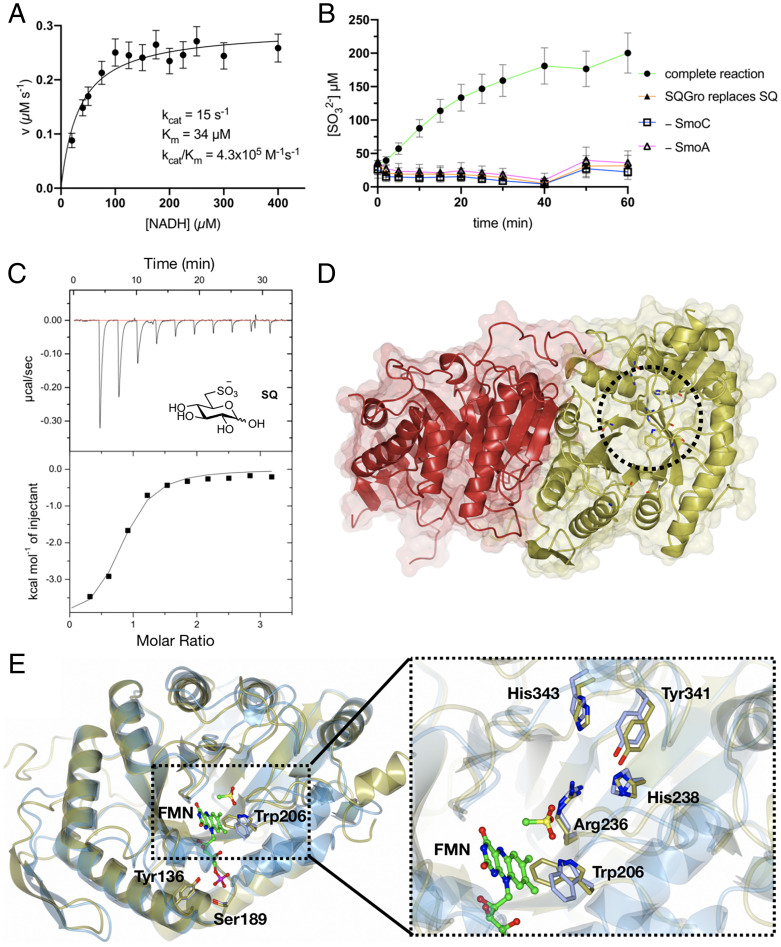
Fig. 3.
Biochemical and structural analyses of the flavin reductase SmoA and SQ monooxygenase SmoC. (A) Michaelis-Menten kinetics for SmoA-catalyzed reduction of FMN by NADH. The data are representative of two independent replicates (SI Appendix, Fig. S10); error bars denote observational errors (derived by propagation of estimated random error). (B) SmoC activity assessed using sulfite release assay with Ellman’s reagent in the presence of FMN, flavin reductase, NADH, and SQ. The data are representative of two independent experiments (SI Appendix, Fig. S11); error bars denote observational error (derived by propagation of estimated random errors). (C) Isothermal titration calorimogram of interaction of SmoC with SQ as determined by ITC. The data are representative of two independent experiments (SI Appendix, Fig. S13). (D) Transparent molecular surface and ribbon diagram of RoSmoC homodimer showing cofactor binding pocket and active site (dotted circle). (E) Alternative orientation of RoSmoC monomer (in gold) overlaid with the MsuD·FMN·CH3SO3− complex (7K14.pdb in ice blue) showing FMN from the latter. Expansion shows view of proposed substrate-binding pocket and conserved residues lining the active site of RoSmoC.

