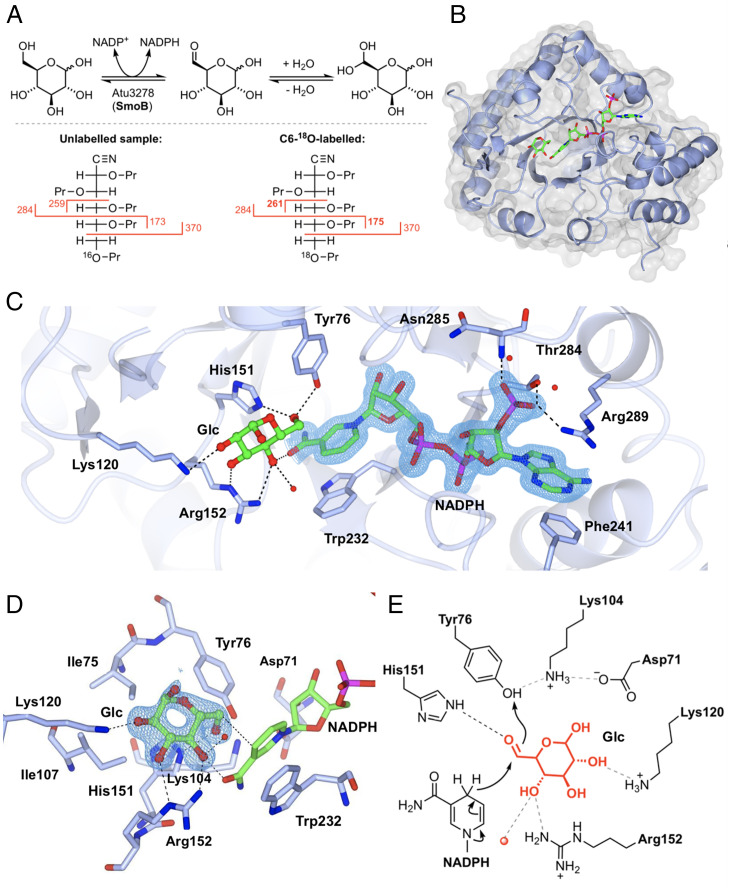
Fig. 4.
Biochemical and structural analyses of 6-OG reductase SmoB. (A) Top: Equilibrium oxygen exchange at C-6 of Glc via 6-OG facilitated by SmoB when incubated with NADP+ in H218O. Bottom: Derivatization and MS fragmentation allows localization of 18O to C6 of Glc. (B) Transparent molecular surface and ribbon diagram of SmoB in complex with NADPH and Glc. (C) Closeup view of SmoB•NADPH•Glc ternary complex. Backbone and carbon atoms of SmoB are shown in ice blue, and NADPH and glucose are shown in cylinder format. Electron density for NADPH corresponds to the 2Fo − Fc map in blue at levels of 1σ. (D) Substrate-binding pocket of SmoB depicting hydrogen-bonding interactions of glucose with the active site residues, including the conserved catalytic residues Asp71, Lys-104, His151, and Tyr76. Electron density corresponds to the 2Fo − Fc map (in blue) at levels of 1σ. The geometry of the SmoB-Glc complex indicates the likely trajectory of hydride addition to 6-OG. (E) Proposed mechanism of SmoB catalyzed reduction of 6-OG by NADPH showing hydride transfer from C4 of nicotinamide ring of NADPH to C6 carbonyl and Y76 (within the catalytic tetrad) as the proton donor. The red sphere is a bound water molecule; dotted lines are proposed hydrogen bonds.

