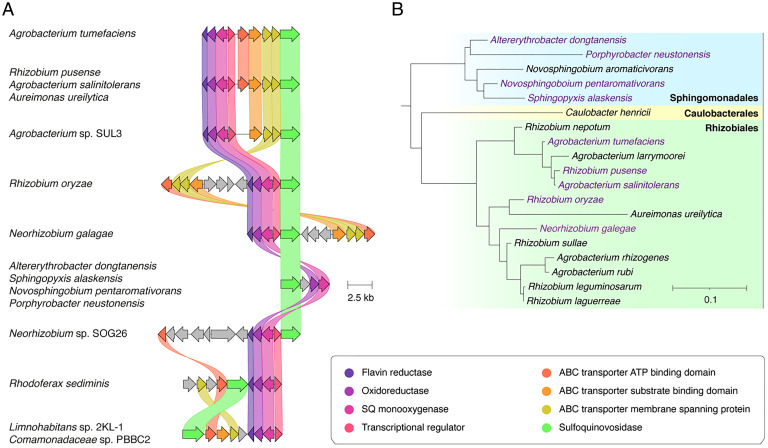
Fig. 5.
Prevalence of the SMO pathway. (A) Architecture of the SMO gene cluster in A. tumefaciens and homologous gene clusters in other organisms. Colored links indicate ≥30% protein sequence similarity. Only those clusters encoding putative SQ monoxygenases and SQases were annotated as putative SMO gene clusters. (B) A phylogenetic tree demonstrating the diversity of organisms possessing putative SMO gene clusters. The tree was constructed by pruning of the All-Species Living Tree Project’s 16s rRNA-based LTP release 132 (https://www.arb-silva.de/projects/living-tree/).

