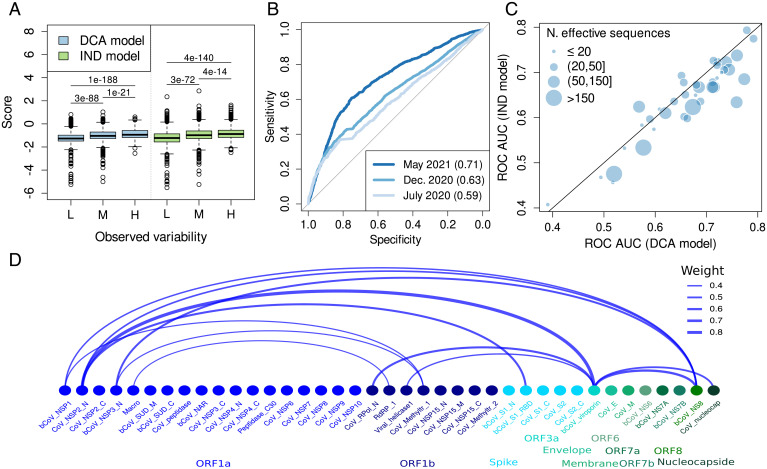
Fig. 4.
(A) Distribution of DCA and IND scores as a function of the variability (L, low <7, n = 2,757 positions; M, medium = [7,15], n = 2,647; H, high >15, n = 2,554) for the entire SARS-CoV-2 proteome (P values from the Wilcoxon signed-rank test). L, M, and H in the x axis correspond to low, medium, and high observed variability, respectively. (B) ROC curve for the classification provided by the DCA model for positions with low (≤3, n = 4,873 in December 2020) or high (>3, n = 3,085 in December 2020) variability, where the variability is estimated from data until May 2021, December 2020, or July 2020. (C) Comparison of ROC AUC obtained by the DCA and IND models for the 39 domains in the proteome. The variability cutoff for each domain is chosen to give rise to two balanced subsets of positions. (D) The nodes represent the Pfam domains in the proteome with a link between pairs of domains when they have at least one relatively strong epistatic coupling. The width of the link is proportional to the strength of the signal, or weight, which comes from the strongest coupling among all the interdomain pairs of positions. Protein domains codified within the same open reading frame (ORF) share the same color.

