Fig. 2.
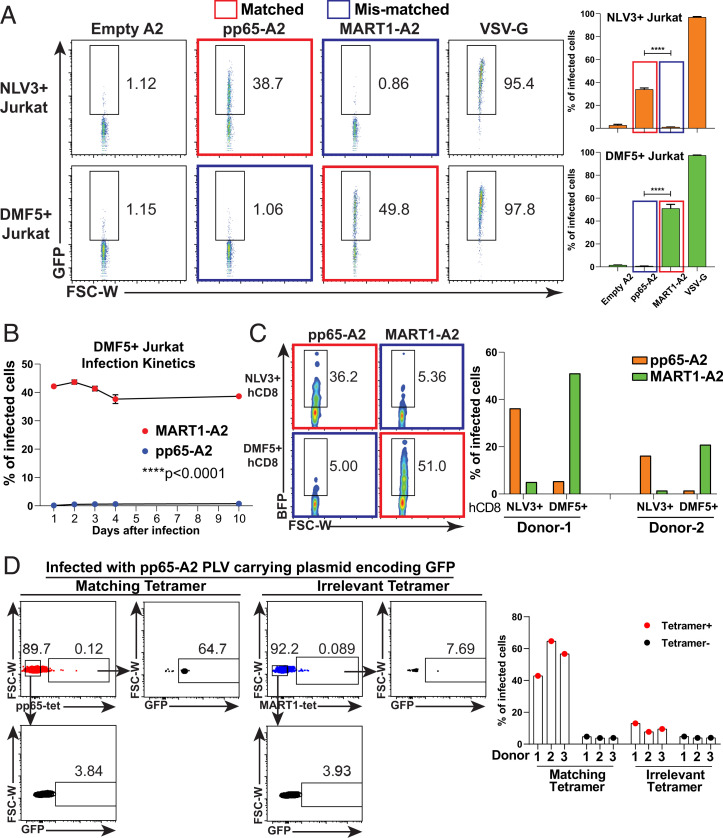
The infection of V-CARMA with antigens presented by class I MHC is TCR specific. (A, Left) Fluorescence activated cell sorting (FACS) plots showing the infections of pHLA-PLVs displaying empty A2, pp65-A2, MART1-A2, and VSV-G to CD8+ Jurkat cells expressing the NLV3 TCR (Top) and the DMF5 TCR (Bottom). The matched pair of antigen and TCR is labeled with a red box, and the mismatched pair of antigen and TCR is labeled with a blue box. (A, Right) Statistical analysis of the FACS results on the Left (n = 3 per group). (B) Time-course analysis of pHLA-PLVs displaying MART1-A2 (red dots) and pp65-A2 (blue dots) infection to CD8+ Jurkat cells expressing DMF5 TCR at days 1, 2, 3, 4, and 10 after infection by flow cytometry (n = 2 per group). (C, Left) FACS plots of pHLA-PLVs displaying empty-A2, pp65-A2, and MART1-A2 infection to primary human CD8 T cells expressing NLV3 TCR (Top) and DMF5 TCR (Bottom). (C, Right) Quantitation graph of the flow cytometry results on the Left. Primary CD8 T cells from two individual donors were tested. (D, Left) FACS plots of pHLA-PLVs displaying pp65-A2 infection to primary human CD8 T cells and tetramer staining with matching tetramer (Left) and irrelevant tetramer (Right). (D, Right) Quantitation graph of the flow cytometry results on the Left. Primary CD8 T cells from three individual donors were tested. Data are presented as mean ± SEM and are representative of two independent experiments. ****P < 0.0001.

