Fig. 3.
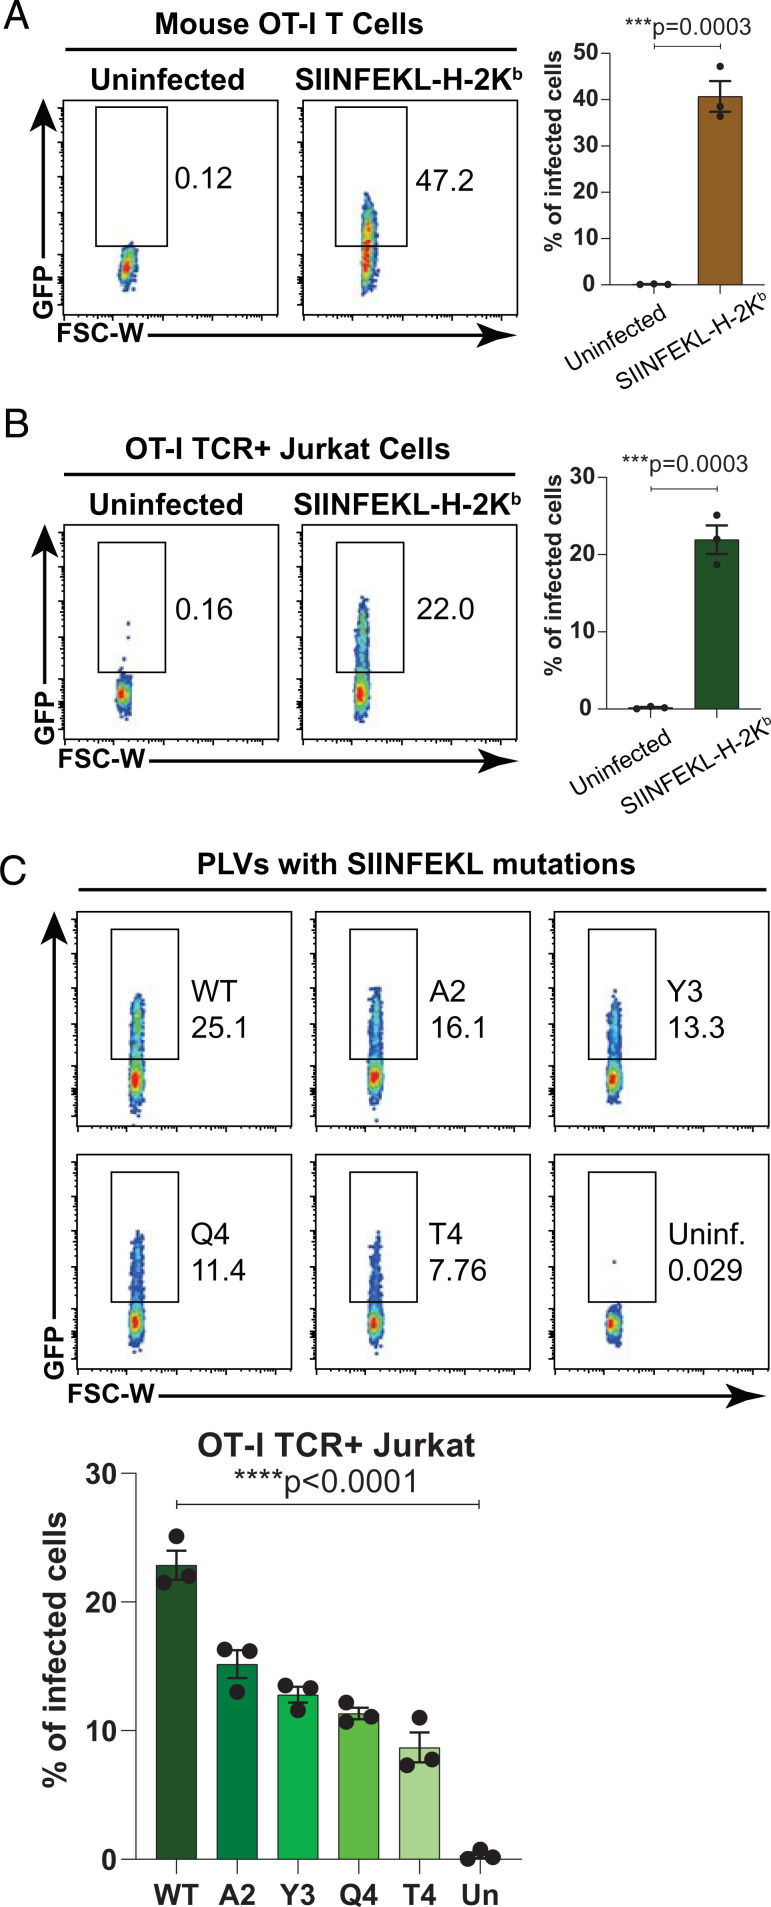
PLVs with SIINFEKL-H-2Kb and its mutants can infect T cells expressing OT-I TCR by their binding affinity. (A and B, Left) FACS plots showing the infections of pHLA-PLVs displaying SIINFEKL-H-2Kb to primary mouse OT-I CD8 T cells (A) and Jurkat cells expressing OT-I TCR (B). (A and B, Right) Statistical analysis of the FACS results on the Left (n = 3 per group). (C, Top) FACS plots showing the infections of pHLA-PLVs displaying SIINFEKL-H-2Kb and mutants (I2A, I3Y, N4Q, and N4T) to Jurkat cells expressing OT-I TCR. (C, Bottom) Quantitation graph of the flow cytometry results on the Top (n = 3 per group). Data are presented as mean ± SEM and are representative of two independent experiments.

