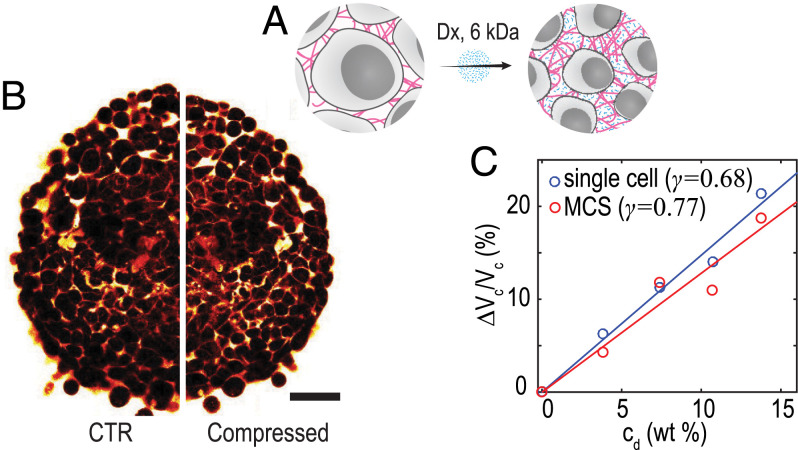
Fig. 1.
(A) Schematic representation of the isotropic osmotic compression by Dx. (B) Two-photon images of MCS captured before and after shocks with 6 kDa Dx. (Scale bar: 100 µm.) (C) Variation of single-cell volume vs. Dx concentration measured by FXm on single cells (blue markers and line fit) and determined from MCS volume variations (red markers and line fit) (SI Appendix, Note 1).

