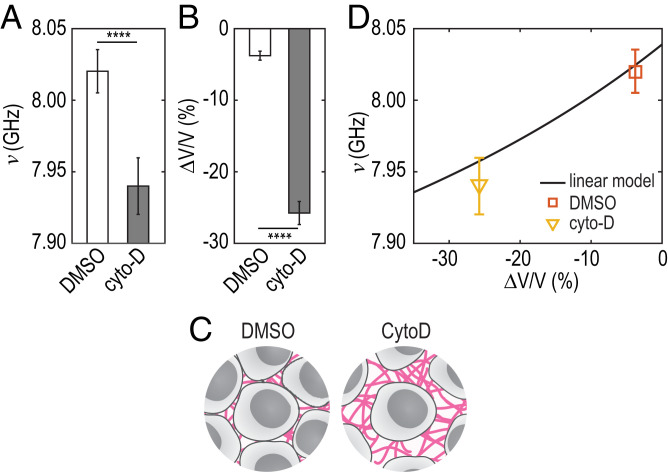
Fig. 4.
(A) Frequency shift and (B) normalized volume measured in the agarose microwells measured on MCS treated with DMSO or cytoD. , unpaired two-tailed t test. (C) Schematic representation of the compression by cytoD. (D) Frequency shift predicted by the linear model (solid line) vs. volume change of MCS treated with DMSO (square) and cytoD (triangle).

