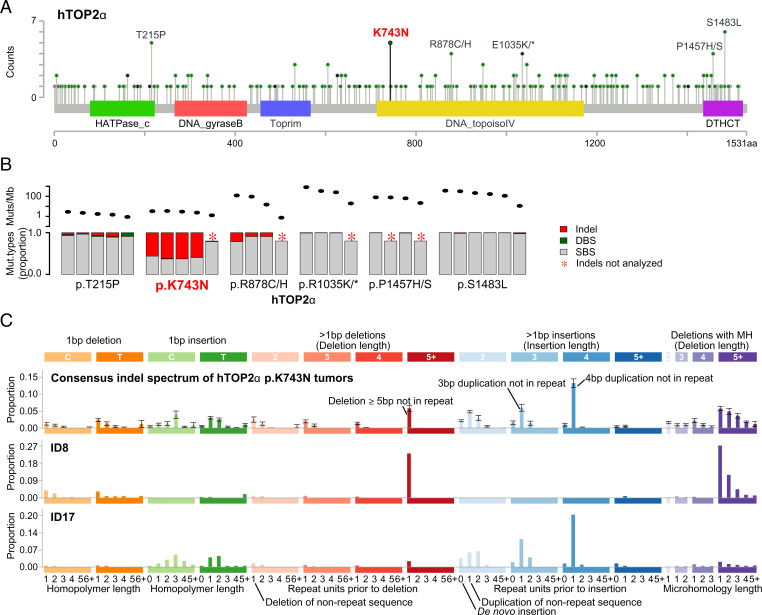
Fig. 1.
hTOP2α hotspot mutations and associated mutagenesis. (A) Recurrent amino acid substitutions in hTOP2α (figure generated using MutationMapper) (43). Amino acid positions are marked on the x axis and domains are shown by colored rectangles with names below. (B) Total mutation counts and proportions of indel, DBS, and SBS mutations in hTOP2α hotspot carriers as reported by Alexandrov et al. (11). Ovals in the Top subpanel show the combined mutation load of indels, DBSs, and SBSs; bars in the Bottom panel show the proportions of indels (red), DBSs (green), and SBSs (gray). (C) Consensus indel mutation spectrum of tumors carrying the hTOP2α p.K743N substitution and the ID8 and ID17 indel mutational signatures (11). Each bar shows the mean proportion of indels in a given indel class; error bars show SEM. Abbreviations: DBS, doublet base substitution; MH, microhomology; Mut, mutation; SBS, single base substitution. Please see https://www.synapse.org/#!Synapse:syn11801742 for an explanation of the indel classes.

