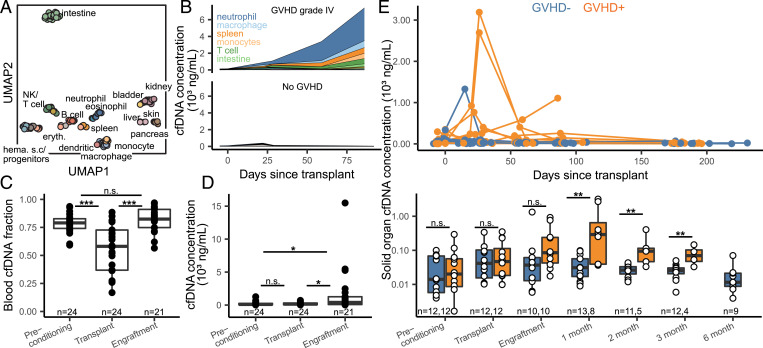
Fig. 2.
Host-derived cfDNA dynamics before and after HCT. (A) Uniform manifold approximation and projection (UMAP) dimensional reduction of cell and tissue methylation profiles. Individual tissues are colored by UMAP coordinates using a linear gradient where each of the four corners is either cyan, magenta, yellow, or black. (B) Examples of cfDNA dynamics in the case of severe GVHD (patient 003, Top) and no GVHD (patient 017, Bottom) in the first 3 mo posttransplant. (C and D) Effect of conditioning and HCT infusion on cfDNA composition (C) and absolute concentration (D). (E) Solid-organ–derived cfDNA concentration in plasma. Top: solid-organ cfDNA and days posttransplant for each patient timepoint. Bottom: solid-organ cfDNA by timepoint. Samples are removed from analysis if plasma was collected after GVHD diagnosis. *P < 0.05; **P < 0.01; ***P < 0.001.

