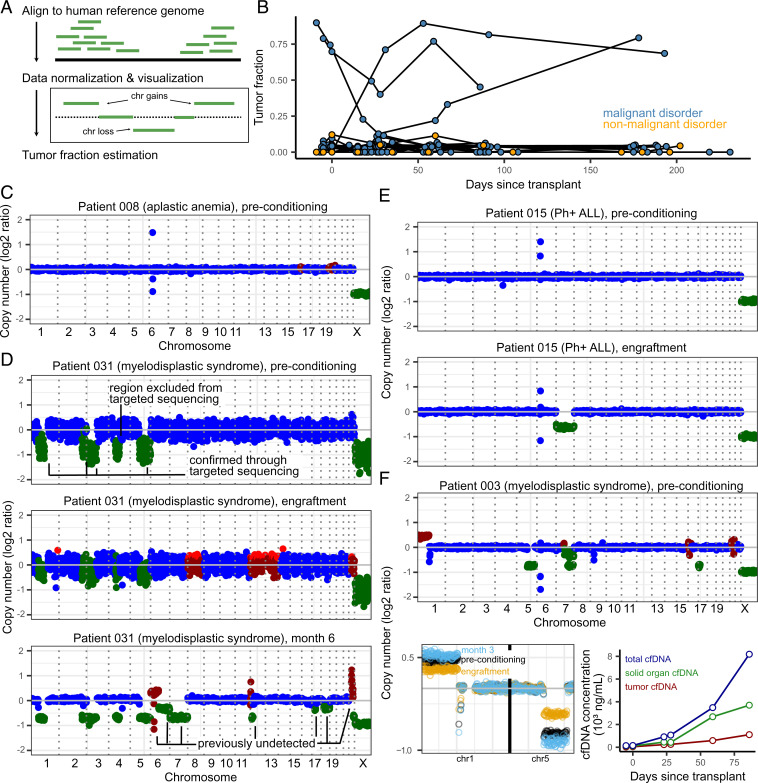
Fig. 4.
(A) Overview of tumor fraction estimation using CNAs. (B) Tumor fractions as measured through ichorCNA at all collected timepoints. Patients without malignant disease and without CNAs (as identified through targeted sequencing) were used to gauge the error in tumor fraction measured by ichorCNA (up to 12%). (C) Example of a CAN profile in a patient with a nonmalignant blood disorder (with no alterations expected). The few outliers in the coverage plot for patient 008 are likely due to errors in sequence mapping. Genome-wide plots in (C–F) (Top only in F) are colored by ichorCNA’s identification of a given region as neutral (blue), gained (red), or lost (green). (D–F) CAN profiles of three patients with measurable CNA-based tumor fractions. (D) Patient 015 was found to have loss of chromosome 7 at the time of engraftment and in all subsequent samples. (E) Patient 031, over the course of their treatment, developed additional, clinically undetected structural variants. (F) Patient 003 (deceased on day 91) had detectable tumor fraction and clinical evidence of GVHD. Solid-organ–derived cfDNA was higher than the tumor load (line plot, Right-hand side). Top: genome-wide coverage plot. Bottom Left: copy number profiles on chromosomes 1 and 5 show a decrease in copy number changes at engraftment (yellow) and subsequent increase at month 3 (blue), when compared to the preconditioning timepoint (black). Bottom Right: Tumor- and solid-organ–derived cfDNA concentration at all available timepoints for patient 003. Patients 003, 008, 015, and 031 were all male–male donor–recipient pairs.

