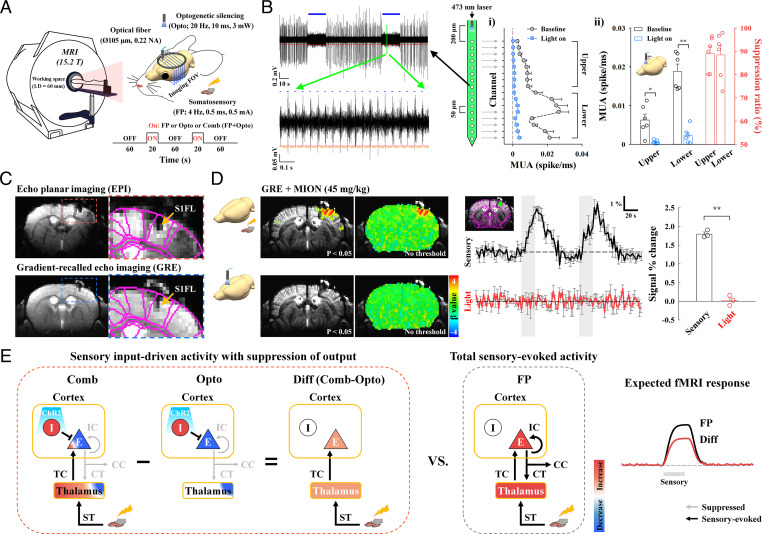
Fig. 1.
Experimental setup for high-resolution, CBV-weighted optogenetic mouse fMRI and conceptual neural circuit analysis. (A) Schematic of multislice fMRI at 15.2 T during FP somatosensory stimulation and during cortical inactivation without (Opto) and with (Comb) somatosensory stimulation. (B) Silencing spontaneous activity of excitatory neurons in the S1FL by optogenetic excitation of inhibitory neurons in VGAT-ChR2 mice (n = 6). A 16-channel optoelectrode with 50 µm interchannel spacing was inserted to a 1-mm depth, and photostimulation was delivered on the surface of the cortex. During two 20-s photostimulation periods (blue bars in the left example recording trace), MUAs were reduced; in the expanded view, MUA is shown to slightly increased during each pulse (blue dots) due to enhanced inhibitory activity but was near zero between pulses (yellowish orange lines) due to suppressed spontaneous activity. During 20 s of photostimulation, spontaneous activity in i) all cortical layers (200- to 1,000-µm depth) and ii) both the upper and lower eight channels was mostly suppressed by activation of inhibitory neurons. Similar uniform suppression across all cortical depths was achieved during photostimulation at the middle of the cortex (SI Appendix, Fig. S2B). Blue horizontal bar, 20-s optogenetic stimulus; red, MUA amplitude threshold; yellowish orange, spontaneous MUA count duration; error bar, SEM; *P < 0.05 and **P < 0.01 (paired t test); and suppression ratio in panel ii, attenuation rate of neural activity during optogenetic silencing relative to the baseline activity. (C) High-resolution MRI images of the brain with an optical fiber targeting the S1FL. The image artifacts of distortion and signal drops caused by the optical fiber in gradient-echo echo planar imaging (EPI) (red-dashed box) were minimized by the adoption of gradient-echo imaging with a short TE of 3 ms (yellow arrow, fiber position). For the CBV-weighted fMRI study, a 45-mg/kg dose of a superparamagnetic monocrystalline iron oxide nanoparticle (MION) agent was injected into the animals’ blood. S1FL, primary somatosensory area of the forelimb. Images of a fiber position and a choice of the MION dose are shown in SI Appendix, Fig. S3. (D) No artifactual fMRI responses to light stimulation were observed in naïve mice. To assess potential light-induced MRI artifacts, functional studies in naïve mice were conducted with interleaved FP stimulation and photostimulation of the S1FL with the same experimental protocol used for fMRI with cortical inactivation (n = 3). Somatosensory fMRI was used as the internal control to ensure the reliability of fMRI responses to external stimuli. Sensory-evoked fMRI responses were observed in the S1FL, but responses during photostimulation were absent in fMRI maps with and without a statistical threshold (uncorrected P < 0.05) and in time courses of the S1FL. Thus, fMRI signal changes resulting from light-induced tissue heating were negligible. Black and red time traces, somatosensory-evoked and photostimulated fMRI time courses in the S1FL, respectively; gray vertical bar in time courses, 20-s stimulus; error bars, SEM; and **P < 0.01 (paired t test). (E) Schematic diagrams to dissect sensory-evoked, long-range, and local activity by fMRI with the assistance of optogenetic cortical inhibition. In a simplified circuit, excitatory neurons (E) interacting with inhibitory interneurons (I) in the cortex received TC inputs from the thalamus and produced spiking outputs for IC, CC, and CT downstream activity. Silencing cortical excitatory neurons by activating ChR2-expressing cortical inhibitory neurons suppressed outputs to downstream CT, CC, and IC pathways (Opto), while simultaneous FP stimulation induced sensory-evoked upstream ST and TC inputs to the thalamus and cortex, respectively (Comb). After subtracting fMRI responses to optogenetic inactivation without FP stimulation (Opto) from those with FP stimulation (Comb), the difference signal was related to upstream, input-driven responses (Diff; Comb-Opto) without the direct contribution of inhibitory neural activity. The relative contribution of downstream CT, CC, and IC pathways can be determined from the total sensory-evoked activity (Diff versus FP). Blue-to-red color scale, decrease-to-increase relative to baseline activity.

