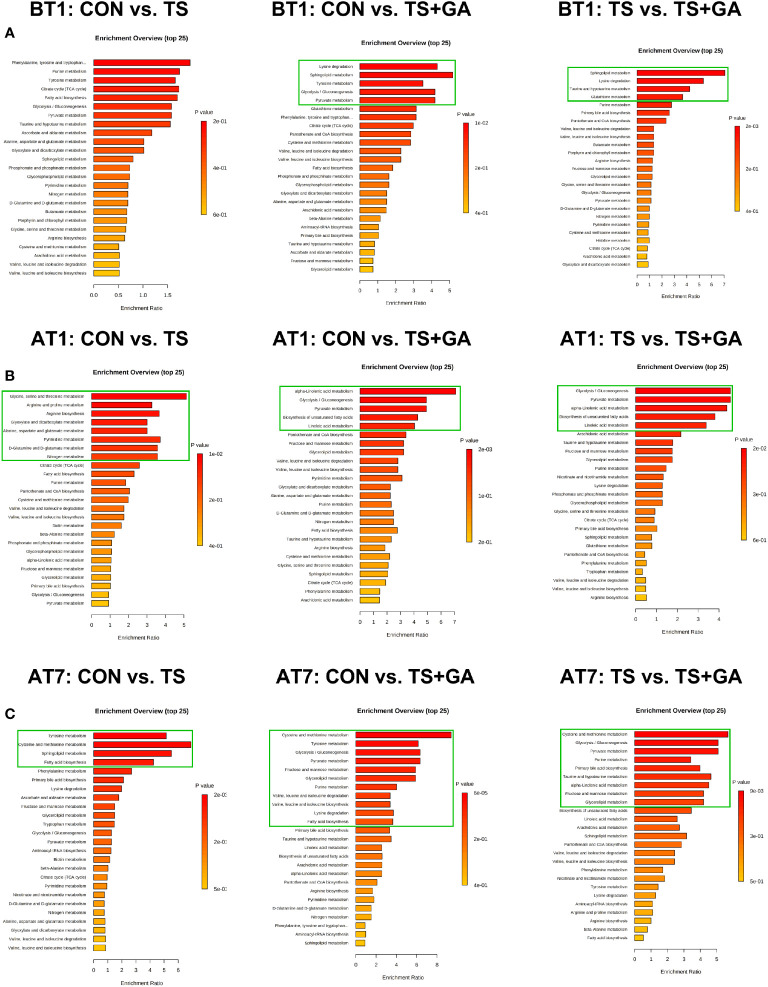
Figure 9.
Bar charts of the metabolic pathway analysis of differential serum metabolites on BT1 (A), AT1 (B), and AT7 (C) (n = 6 or 7). The pathway enrichment analysis shows all matched pathways, and the green boxes indicate significant metabolic pathways (p < 0.05). BT1, the 1st day before transportation; AT1, the 1st day after transportation; AT7, the 7th day after transportation.

