Figure 1.

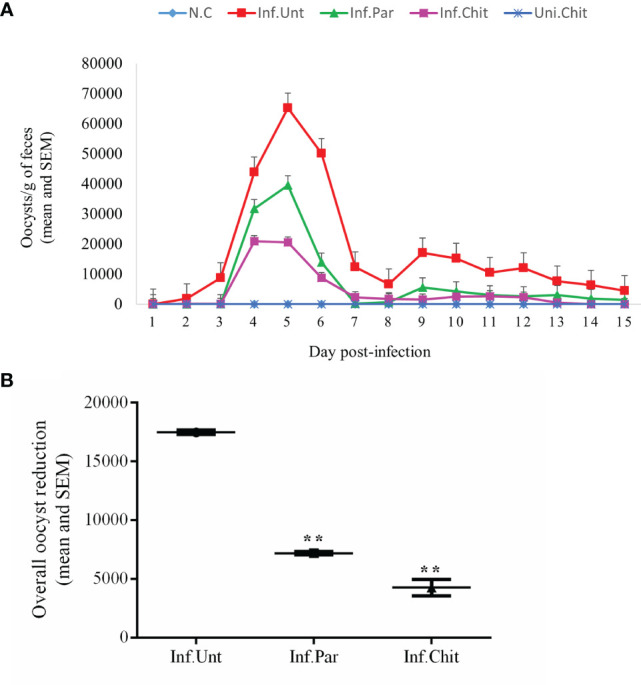
Cryptosporidium parvum oocyst shedding pattern. (A) Infection intensity in different groups during treatment days. C. parvum infection was established by oral gavage of ∼106 C. parvum oocysts followed by oral treatment with the indicated dose of chitosan or paromomycin (positive control). Lines and dosing regimen are color coded as follows: blue line (normal control); red line (infected + untreated); green line (infected + paromomycin treated 50 mg/kg/day); purple line (infected + chitosan treated 1 mg/kg/day); darker blue line (uninfected + chitosan treated 1 mg/kg/day). (B) Overall oocyst reduction rate between Inf.Unt, Inf.Par, and Inf.Chit treatment groups. Data are the mean ± SEM of three independent tests. **p < 0.01 statistical difference comparison of the Inf.Unt group with Inf.Par and Inf.Chit groups.
