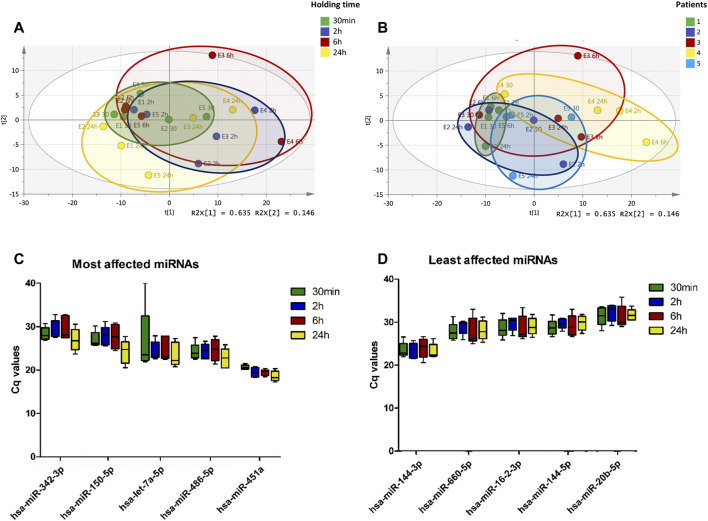
FIGURE 2.
Plasma miRNA expression profile changes with increasing holding time. Whole blood collected from pregnant women were stored at 4°C for 30 min, 2, 6 and 24 h prior to processing for plasma. The expression of plasma miRNAs was determined using RT-qPCR. Principal component analysis (PCA) scores plot of 179 plasma miRNAs colored according to holding time, A 30 min (green), B 2 h (blue), C 6 h (red), and D 24 h (yellow) shows clustering of samples with 30 min holding time (A). PCA shows increase in variability in the plasma miRNA profiles associated with increasing holding time. PCA scores plot of 179 plasma miRNAs colored according to samples, 1 to 5, shows that there is sample-dependent variability in the plasma miRNA profile changes associated with increasing holding time (B). Top 10 miRNAs affected by blood holding time (C) and top 10 most stable miRNAs over holding time (D) were identified using coefficient of variation.

