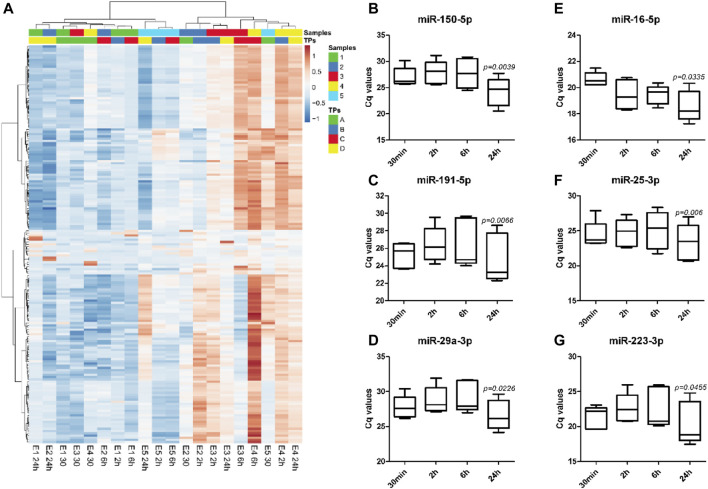
FIGURE 3.
The direction and the extent of changes in miRNA expression profiles with increasing holding time is sample-dependent. Unsupervised hierarchical clustering analysis shows expression profiles of 179 plasma miRNAs in EDTA samples with different holding times (TPs), A: 30 min, B: 2 h, C: 6 h, and D: 24 h (A). Heatmap was built based on Cq values from RT-qPCR using Pearson correlation and Ward linkage. Significant changes in the expression of specific miRNAs associated with preterm birth, miR-150-5p (B), small-for-gestational-age births, miR-191-5p (C), and preeclampsia, miR-29a-3p (D), were observed with increasing holding time. Commonly used endogenous miRNA controls in plasma such as miR-16-5p (E), miR-25-3p (F), and miR-223-3p (G), were also affected by blood holding time.

