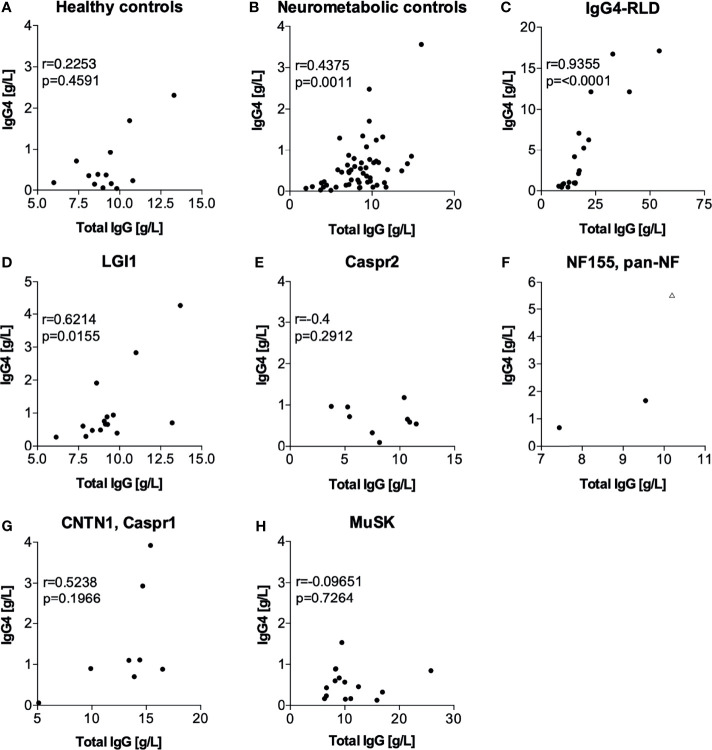
Figure 3.
Correlation between serum IgG4 and total IgG concentrations (statistical analysis with Spearman correlation in datasets with at least 3 datapoints). (A) healthy controls, (B) neurometabolic controls, (C) IgG4-RLD, (D) LGI1, (E) Caspr2, (F) NF155, (G) CNTN1, Caspr1 and (H) MuSK. In (F), the triangular data point indicates a patient that was excluded from the statistical analysis due to the presence of pan-NF antibodies instead of NF155 antibodies and severe concomitant autoimmune diseases. Caspr1, contactin-associated protein-like 1; Caspr2, contactin-associated protein-like 2; CNTN1, contactin 1; IgG, immunoglobulin type G; IgG4, immunoglobulin type G subclass 4; IgG4-RLD, IgG4-related disease; LGI1, leucine-rich glioma inactivated protein- 1; MuSK, muscle-specific kinase; NF155, neurofascin 155.

