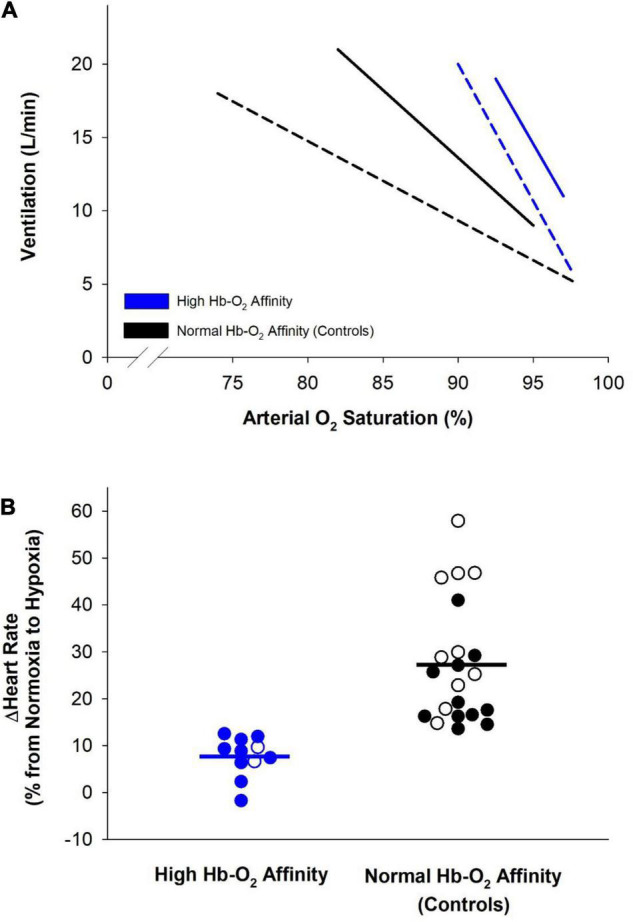
FIGURE 2.

Cardiorespiratory adjustments elicited during hypoxia by humans with high hemoglobin-O2 (Hb-O2) affinity (blue lines and symbols) and controls with normal Hb-O2 affinity (black lines and symbols). (A) Relationship of minute ventilation and arterial O2 saturation among humans with high Hb-O2 affinity compared to normal Hb-O2 affinity controls during progressive isocapnic hypoxia. Dashed lines represent data from Hebbel et al. (1977) where hypoxia was increased such that alveolar PO2 was lowered from 120 to 40 mmHg over ∼5 min (n = 2 humans with high Hb-O2 affinity and n = 2 humans with normal Hb-O2 affinity). Solid lines represent data from Dominelli et al. (2019) where hypoxia was increased such that end-tidal PO2 was lowered from normal room-air values to 50 mmHg over ∼12 min (n = 9 humans with high Hb-O2 affinity and n = 12 humans with normal Hb-O2 affinity). (B) Percentage increase in heart rate during progression of normoxia to hypoxia among humans with high Hb-O2 affinity compared to normal Hb-O2 affinity controls. Open symbols represent data from Hebbel et al. (1977) where heart rate was compared at an alveolar PO2 of 100 and 40 mmHg (n = 2 humans with high Hb-O2 affinity and n = 10 humans with normal Hb-O2 affinity). Filled symbols represent data from Dominelli et al. (2019) where heart rate was compared at normoxia and at an end-tidal PO2 of 50 mmHg (n = 9 humans with high Hb-O2 affinity and n = 12 humans with normal Hb-O2 affinity). Solid bars represent the average change in heart rate in both groups.
