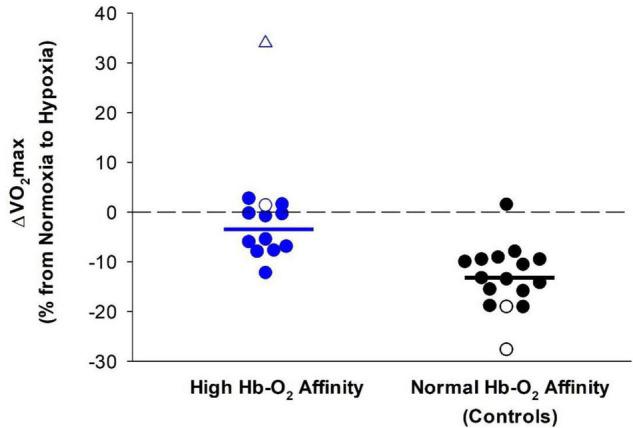
FIGURE 3.

Difference in O2max between normoxia and hypoxia in humans with high Hb-O2 affinity (blue symbols) (–4 ± 5% without outlier) compared to normal Hb-O2 affinity controls (black symbols) (–13 ± 6%). Open symbols represent data from Hebbel et al. (1978). The open triangle represents an outlier not included in the calculation of the mean. Closed symbols represent data from Dominelli et al. (2020). Solid bars represent the average change in O2max in both groups not including the outlier with high Hb-O2 affinity. The dashed line provides a reference for no change.
