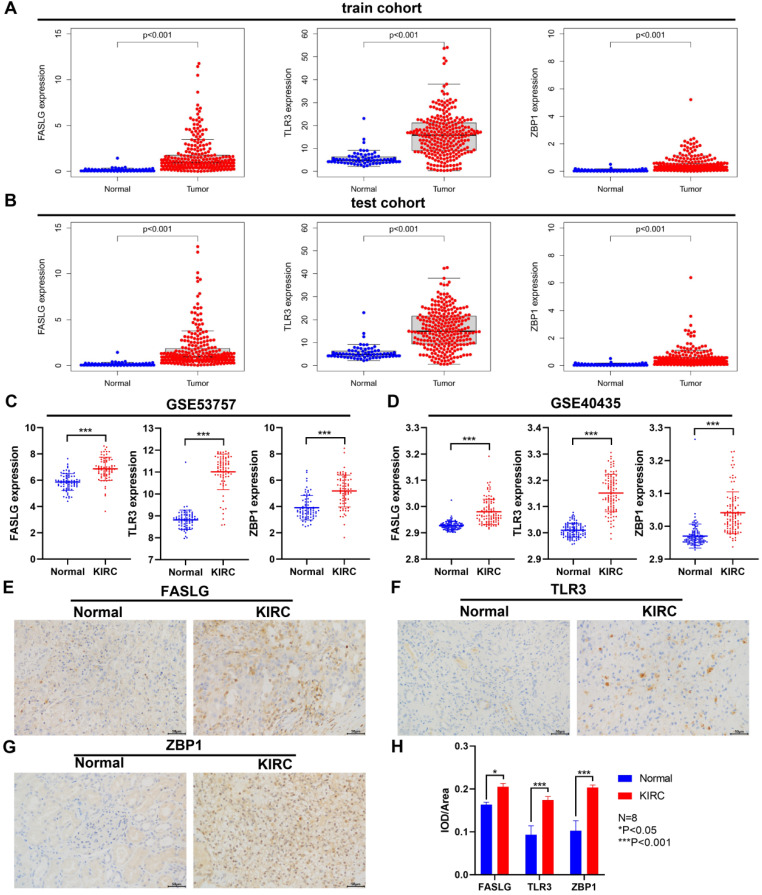
Figure 8.
Differential expressions of NRGs by GEO and IHC staining validation. The comparison of FASLG, TLR3, and ZBP1 expressions between KIRC and normal samples in train cohort (A) and test cohort (B). Differential expressions of FASLG, TLR3, and ZBP1 validated by GSE53757 (C) and GSE40435 (D) datasets. (E-G) IHC staining was applied to validate the differential expressions of FASLG, TLR3, and ZBP1 using KIRC samples from our clinical center. Scale bar = 50 µm. (H) Image Pro Plus 6.0 image software was applied to assess the relative expressions of FASLG, TLR3, and ZBP1 which were presented as average optical density. Data are expressed as mean ± SEM.

