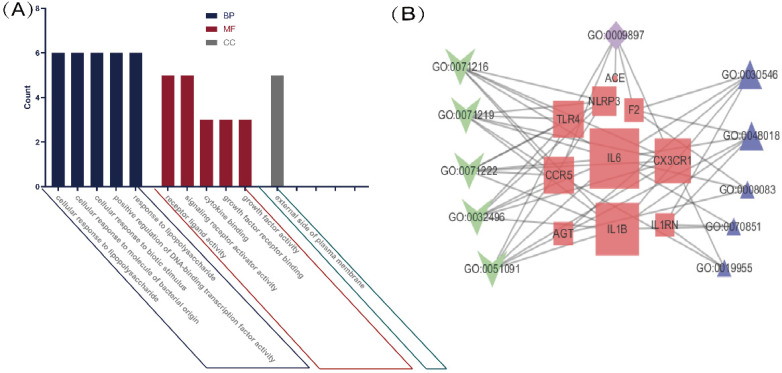
Figure 2.
GO analysis of intersection genes and network visualization. Notes: (A) GO analysis of intersection genes. The value on the Y-axis represents counting the intersection genes in each GO term. Blue represents BP, red represents MF, and green represents CC. The X-axis is the GO term, respectively the top 5 BP, MF and the only cell component enriched according to the count value. (B) Network visualization of gene and GO term. Red represents the common gene, green represents BP, purple represents CC, blue represents MF, the larger the shape means the more connections in the whole network.

