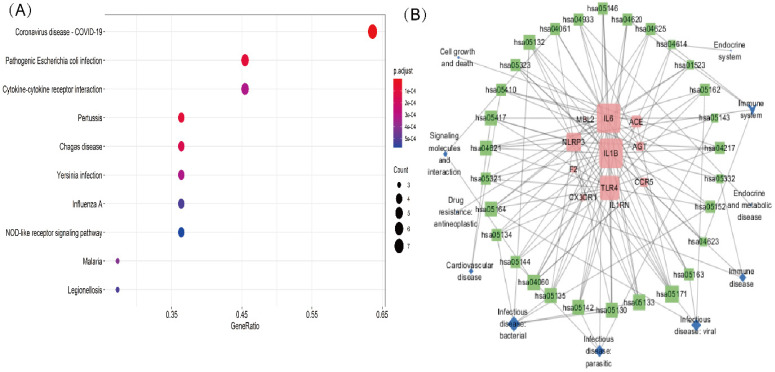
Figure 3.
KEGG analysis of intersection genes and network visualization. Notes: (A) KEGG analysis of intersection genes. A higher GeneRatio value indicates a higher enrichment level; The bigger circle indicates more target genes in the pathway. The color ranges from blue to red of circles indicating that the adjusted p-values increases from small to large and the enrichment results are more significant. (B) Network visualization of intersecting genes and enriched KEGG pathways. Red represents the common gene, green represents the KEGG pathway and blue represents the upper-level classification of the KEGG pathway. The larger the shape, the more connections in the entire network.

