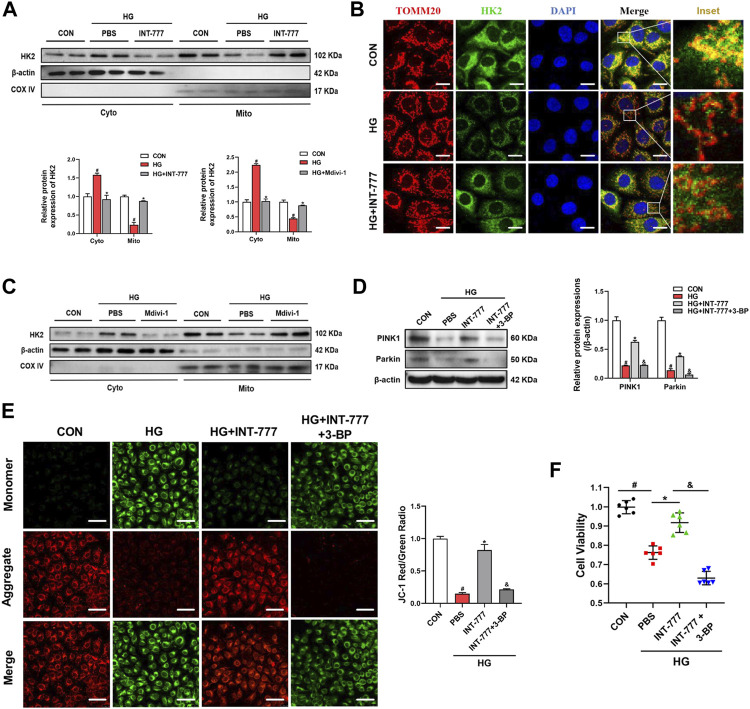
FIGURE 4.
Drp1 inhibits mitophagy by facilitating HK2 separation from the mitochondria. RMECs were pretreated with (A, B) INT-777 (30 μM) or (C) Mdivi-1 (10 μM) for 2 h and then exposed with or without HG (33 mM) for 3 days. RMECs were pretreated with INT-777 (30 μM) or INT-777 (30 μM) + 3-BP (10 μM) for 2 h followed by HG (33 mM) for (D, E) three or (F) 5 days. (A, C) HK2 expression in mitochondrial and cytosolic fractions was detected by Western blot. All data were presented as mean ± SD and analysed by RM ANOVA with Tukey’s HSD test. #p < 0.05 vs. control group, *p < 0.05 vs. HG group. (B) DAPI, HK2 and TOMM20 were subjected to representative immunofluorescence analysis. S (scale bar = 25 μm. (D) Western blot analysis showed the protein expression levels of PINK1 and Parkin. (E) JC-1 dye was used to assess mitochondrial membrane potential in different groups. Quantification of the ratio of fluorescence intensity (red/green) is shown in the bar chart. S (scale bar = 25 μm). (F) Cell viability was measured using the CCK8 assay. All data were presented as mean ± SD and analysed by RM ANOVA with Tukey’s HSD test. #p < 0.05 vs. control group, *p < 0.05 vs. HG group, &$ p < 0.05 vs. INT-777 group.

