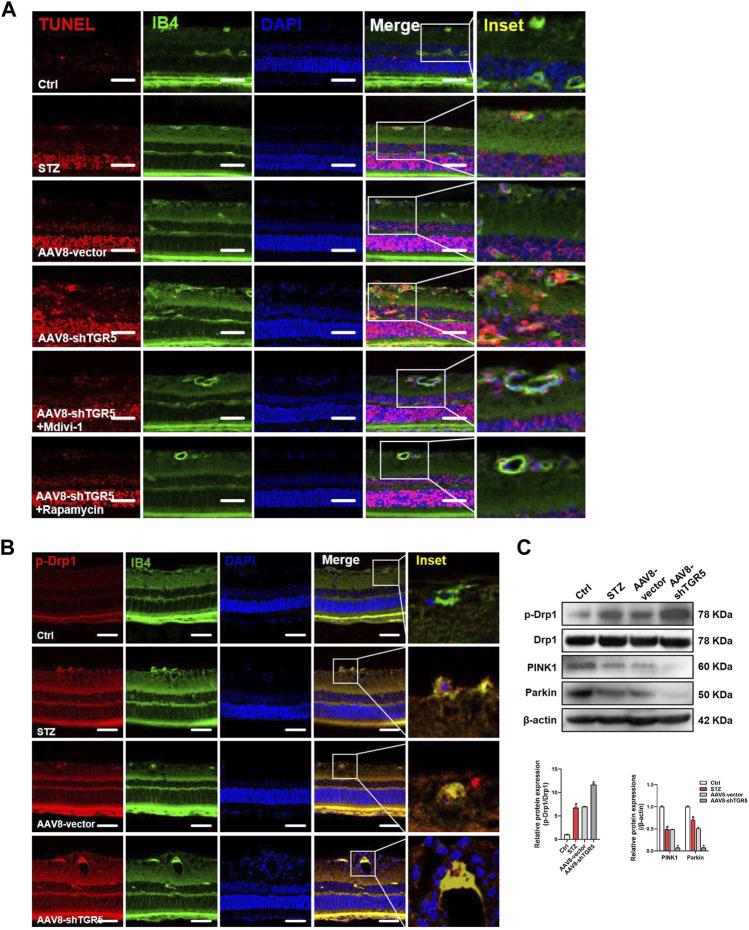
FIGURE 6.
AAV8–shTGR5 aggravates STZ-induced mitochondrial dynamics disorder. (A) Apoptosis was assessed by TUNEL assay in retinal sections. Scale bar = 25 μm. (B) p-Drp1 (red), IB4 (green) and DAPI (blue) in retinal sections were subjected to immunofluorescence staining. Yellow fluorescence showed the colocalisation of green and red fluorescence. Scale bar = 25 μm. (C) Western blot analysis showed the protein expression levels of p-Drp1, Drp1, PINK1 and Parkin. All data were presented as mean ± SD and analysed by RM ANOVA with Tukey’s HSD test. #p < 0.05 vs. control group, *p < 0.05 vs. AAV8-vector group.

