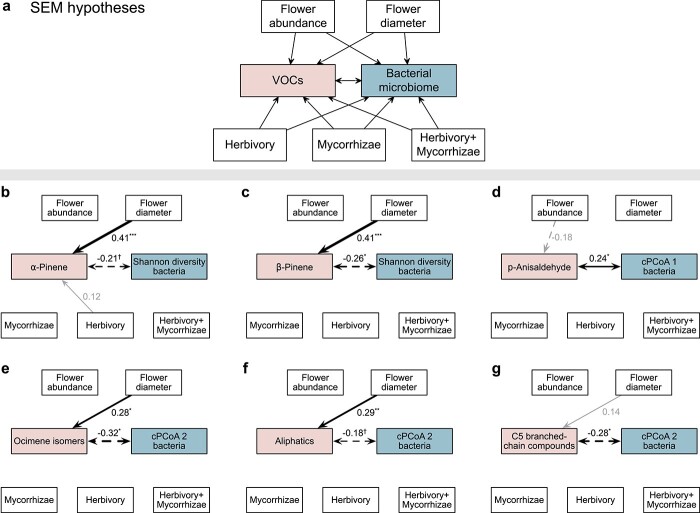
Figure 4.
Structural equation models (SEMs) linking floral phenotype and treatment to floral bacterial microbiome. a, Hypothesized effects of flower abundance and size as well as treatments on floral volatile organic compounds (VOCs) and bacterial microbiome. The floral bacterial microbiome was characterized using α-diversity (Shannon diversity) and β-diversity (the first two axes of constrained principal coordinates analysis, cPCoA1 and cPCoA2). VOCs were evaluated at three levels (see Materials and methods): individual VOCs, major classes of VOCs, and VOC profile (VOC cPCoA1 and cPCoA2). The bidirectional links between VOCs and bacterial microbiome reflected potential reciprocal influence on each other. Treatments were coded using the control treatment as the reference level. SEMs were fitted based on overall genotypic variation using lavaan [19]. b-g, SEMs that contained notable positive (solid black) and negative (dashed black) links between VOCs and bacterial microbiome, as well as other variables, were presented (see SEM details in Supplementary Table 4): †P < 0.10; *P < 0.05; **P < 0.01; ***P < 0.001. Grey links indicate P > 0.10. Link width and the numbers adjacent to links indicate standardized path coefficients.

