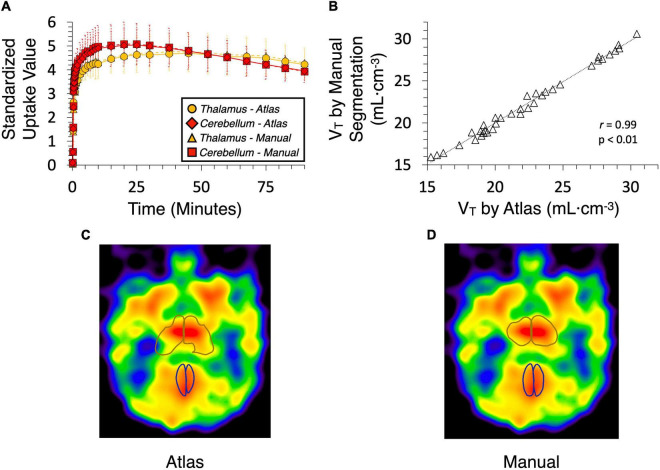
FIGURE 5.
Time-activity curves (TAC) and volumes of distribution (VT) generated from dynamic [11C]benzamide data by baboon atlas and manual segmentation using the human brain template on PMOD. (A) TAC was obtained from the thalamus and cerebellum. (B) Correlation curve of VT (r = 0.99, P < 0.01). (C) Thalamus and cerebellum are defined by the atlas. (D) Thalamus and cerebellum are defined manually.

