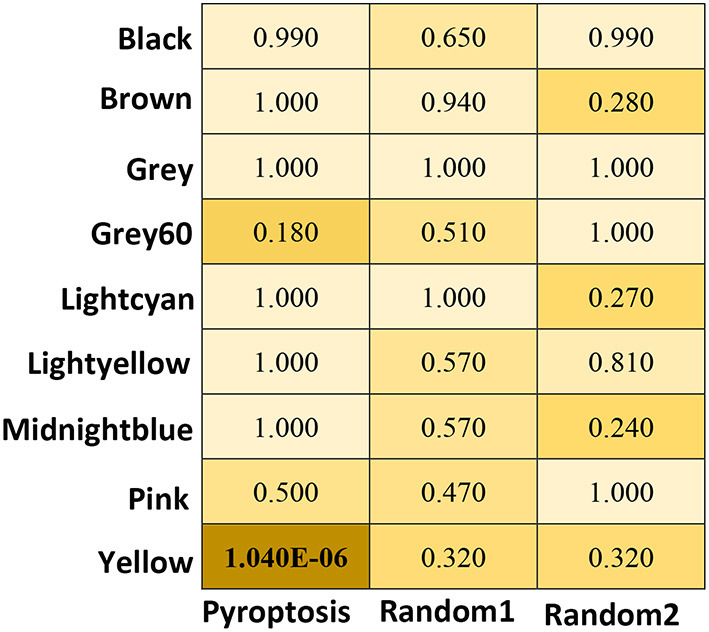
Figure 4.

The heat map of correlation Analysis between the module and the pyroptosis signaling pathway. P are obtained using Fisher's exact test by GeneOverlap R package. The significant values are shows in bold.

The heat map of correlation Analysis between the module and the pyroptosis signaling pathway. P are obtained using Fisher's exact test by GeneOverlap R package. The significant values are shows in bold.