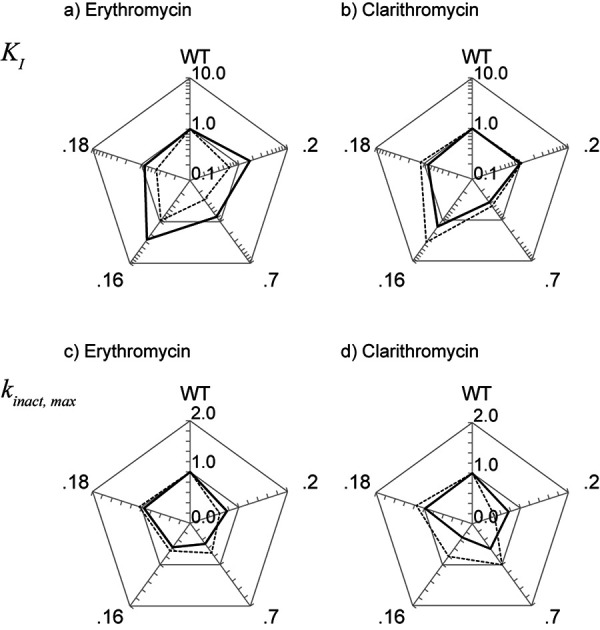
Figure 2. Comparison of MBI parameters between erythromycin and clarithromycin. MBI parameters, K I (a, b) and k inact,max (c, d), for five CYP3A4 genetic variants (Wt, .2, .7, .16, .18) are shown as the ratio to those for WT. The solid and dashed line represent the values assessed using midazolam and testosterone [19], respectively.