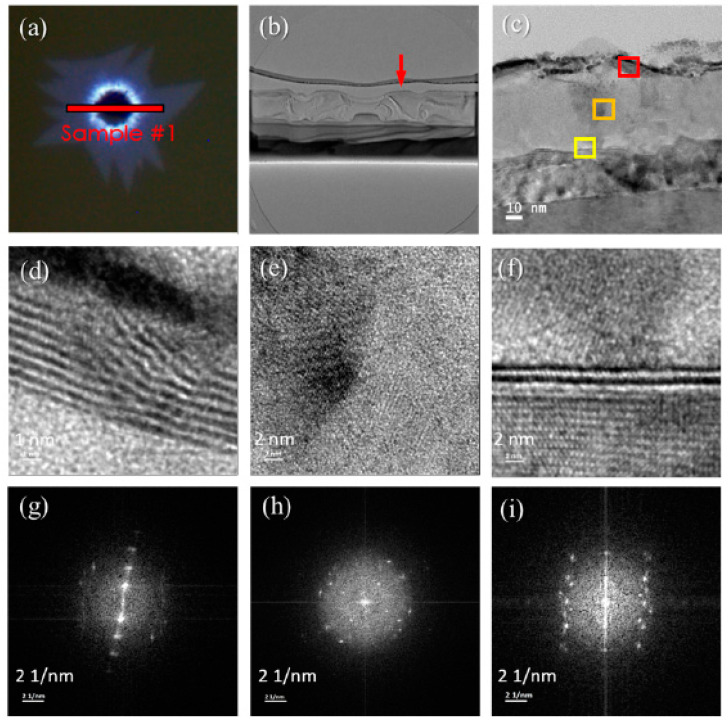
Figure 6.
Panel (a) is the OM image after growing MoS2, (b) is the cross-sectional TEM image of the selected area in (a), (c) is the enlarged TEM image of the red arrow in (b). Panels (d–f) represent the HRTEM images of the red, orange, and yellow boxes in (c), respectively, and (g–i) represent the SAED diagrams in (d–f), respectively.

