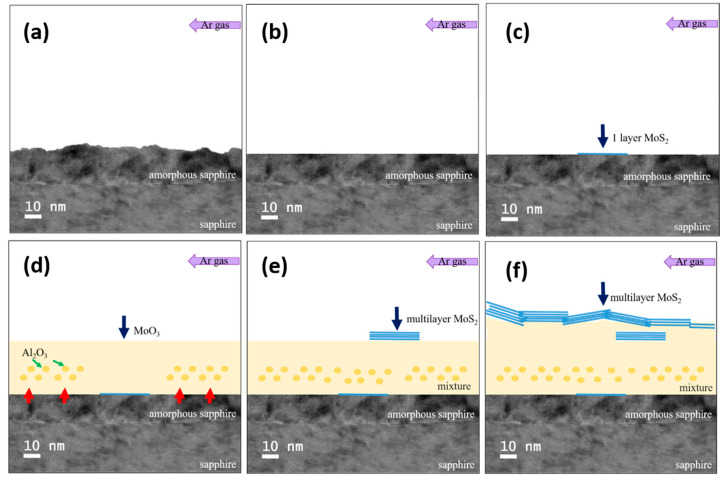
Figure 9.
Schematic of the MoS2 growth process. The purple arrow in the figure is the direction of argon ventilation, and the blue line segment represents a single layer of MoS2. The light yellow area represents the mixed zone dominated by MoO3, the dark yellow dot is amorphous Al2O3 mixed in the reflection, and the blue line segment is superimposed to represent multilayer MoS2.

